Hot Stock Alerts

Potential Breakout Stocks of the Day:
Top Stocks 2021 - TSLA BYND GBTC
Top Penny Stocks 2021 - GBTC

Stock Market Closing Report - 12/8/20 December 8, 2020
Showing posts with label trading visa. Show all posts

Wednesday, July 7, 2010

Visa V Stock Analysis July 2010

By Tim - http://stockstobuy.org

Visa V Stock Chart Analysis - The following is technical analysis for Visa Inc. (NYSE:V) stock for July 7, 2010.

Visa Inc. Support and Resistance Levels: 7/7/10

Resistance - $77.94

Support - $70


Visa Inc. (NYSE:V) is rallying back to it's 10 day moving average located at $74.06. The bears are more likely to sell here and the bulls who like Visa right now will be buying on a close above this level. Visa will also face even tougher resistance near it's 50 day moving average which is just below $78 right now. Until Visa closes back above the 50 day moving average, I would be a seller into rallies. Short below $70
For More Technical Analysis - Go Here

Today's Biggest Stock Market Gainers - Top 2010 Stock Gainers - Top 2010 Penny Stocks - Top 2009 Stock Gainers - Top 2009 Penny Stocks - Stocks for 2010

For the latest updates on the stock market, visit, http://daytradingstockblog.blogspot.com/


Wednesday, May 19, 2010

Visa V Stock Analysis May 2010

By Tim - http://stockstobuy.org
Visa V Stock Chart Analysis - The following is technical analysis for Visa Inc. (NYSE:V) stock for May 19, 2010.

Visa Inc. Support and Resistance Levels: 5/19/10

Resistance - $75

Support - $68.29, $66.24


Discuss Stocks - http://stockstobuy.org

Visa Inc. (NYSE:V) is bouncing today despite a horrible stock market. Visa Inc has support located at $68.29 as well as $66.24 from the fall. I'd be a buyer of Visa if we saw a plunge below $66.24 which would be a steal for the long term.

For More Technical Analysis - Go Here

Today's Biggest Stock Market Gainers - Top 2010 Stock Gainers - Top 2010 Penny Stocks - Top 2009 Stock Gainers - Top 2009 Penny Stocks - Stocks for 2010

For the latest updates on the stock market, visit, http://daytradingstockblog.blogspot.com/


Saturday, March 13, 2010

Visa Inc V Stock Technical Analysis

Visa V Stock Chart Analysis - The following is technical analysis for Visa Inc. (NYSE:V) stock for March 15, 2010.

Visa Inc. Support and Resistance Levels: 3/15/10

Resistance - $100

Support - $90, $86


Discuss Stocks - http://stockstobuy.org

Visa Inc. (NYSE:V) hit a brand new 52 week high on Friday. Visa will have resistance around $100 on the upside with support between $86-$90. I would take the opportunity to buy shares of Visa on a correction closer to $86. Visa is one of my favorite long term stock plays.

For More Technical Analysis - Go Here

Today's Biggest Stock Market Gainers - Top 2010 Stock Gainers - Top 2010 Penny Stocks - Top 2009 Stock Gainers - Top 2009 Penny Stocks - Stocks for 2010

For the latest updates on the stock market, visit, http://daytradingstockblog.blogspot.com/ or Subscribe for Free


Friday, March 12, 2010

Visa Inc V Stock Analysis 2010

Visa V Stock Chart Analysis - The following is technical analysis for Visa Inc. (NYSE:V) stock for March 12, 2010.

Visa Inc. Support and Resistance Levels: 3/12/10

Resistance - $100

Support - $90, $86


Discuss Stocks - http://stockstobuy.org

Visa Inc. (NYSE:V) is trading around $93 in pre market this morning after hitting a new 52 week high on Thursday. Visa will have resistance around $100 on the upside with support between $86-$90. I would take the opportunity to buy shares of Visa on a correction closer to $86. Visa is one of my favorite long term stock plays.

Today's Biggest Stock Market Gainers - Top 2010 Stock Gainers - Top 2010 Penny Stocks - Top 2009 Stock Gainers - Top 2009 Penny Stocks - Stocks for 2010

For the latest updates on the stock market, visit, http://daytradingstockblog.blogspot.com/ or Subscribe for Free


Saturday, December 26, 2009

Visa V Stock Analysis - December 2009

Visa, Inc. (V) Stock Chart Analysis - The following is technical analysis for Visa Inc. (NYSE:V) stock for December 28, 2009.
Visa, Inc. (V) Support and Resistance Levels: 12/28/09

Resistance - $88, $89.69

Support - $86.15, $81.90, $80


http://stockcharts.com/ - Chart

Discuss Stocks - http://stockstobuy.org

Visa, Inc. (V) stock is pulling back to the 10 day moving average after the recent spike higher. If VISA closes below this level, I'd watch out for a possible retest of the 50 day moving average. On the upside, I'm watching the recent high of $89.69. I will be a buyer of a close over $90.

For More Technical Analysis - Go Here

Today's Biggest Stock Market Gainers - Top 2009 Stock Gainers - Top 2009 Penny Stocks

For the latest updates on the stock market, visit, http://daytradingstockblog.blogspot.com/ or Subscribe for Free

Saturday, November 28, 2009

Visa V Stock Analysis - November 2009

Visa, Inc. (V) Stock Chart Analysis - The following is technical analysis for Visa Inc. (NYSE:V) stock for November 30, 2009.

Visa, Inc. (V) Support and Resistance Levels: 11/30/09

Resistance - $81.90

Support - $75.54, $72.35


Discuss Stocks - http://stockstobuy.org

Visa, Inc. (V) is trading sideways after the early November break out. Keep an eye on $81.90, a close above that level would be bullish and extend the uptrend. On the downside, I would be a buyer of a correction back to the 50 day moving average located at $75.54. Visa Inc is a great stock for every long term portfolio. For More Technical Analysis - Go Here

Today's Biggest Stock Market Gainers - Top 2009 Stock Gainers - Top 2009 Penny Stocks

For the latest updates on the stock market, visit, http://daytradingstockblog.blogspot.com/ or Subscribe for Free

Friday, October 2, 2009

Visa V Stock Technical Analysis October 2009

Visa V Stock Chart Analysis - The following is technical analysis for Visa Inc. (NYSE:V) stock for October 5, 2009.

Visa Support and Resistance Levels: 10/5/09

Resistance - $69.81, $71.26

Support - $66.04, $65.25, $61


Discuss Stocks - http://stockstobuy.org

Visa Inc. (NYSE:V) has closed below the 50 day moving average for the past 4 trading sessions. I would not touch the stock until it closes back over the 50 day moving average ( $69.81 ) or retests the 200 day moving average ( $60.92). Keep an eye on the previous two lows of $66.04 & $65.25. If Visa breaks these lows, you might want to try going short for a trade. For More Technical Analysis - Go Here

Today's Biggest Stock Market Gainers - Top 2009 Stock Gainers - Top 2009 Penny Stocks

For the latest updates on the stock market, visit, http://daytradingstockblog.blogspot.com/ or Subscribe for Free
Thursday, August 27, 2009

Visa V Stock Technical Analysis 8/28/09

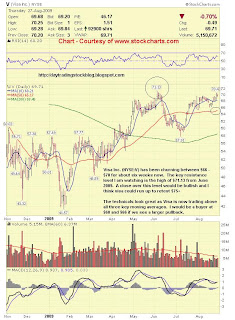
Visa V Stock Chart Analysis - The following is technical analysis for Visa Inc. (NYSE:V) stock for August 28, 2009.

Visa Support and Resistance Levels: 8/28/09

Resistance - $70.43, $71.13, $75

Support - $68, $66


Discuss Stocks - http://stockstobuy.org

Visa Inc. (NYSE:V) has been churning between $66 - $70 for about six weeks now. The key resistance level I am watching is the high of $71.13 from June 2009. A close over this level would be bullish and I think visa could run up to retest $75+

The technicals look great as Visa is now trading above all three key moving averages. I would be a buyer at $68 and $66 if we see a larger pullback.
For More Technical Analysis - Go Here

Today's Biggest Stock Market Gainers - Top 2009 Stock Gainers - Top 2009 Penny Stocks

For the latest updates on the stock market, visit, http://daytradingstockblog.blogspot.com/ or Subscribe for Free

Tuesday, June 23, 2009

Visa V Stock Analysis June 23 2009 6/23/09

Visa V Stock Chart Analysis - The following is technical analysis for Visa Inc. (NYSE:V) stock for June 23, 2009.

Visa Support and Resistance Levels: 6/23/09

Resistance - $63, $64, $67

Support - $60, $58, $57, $52.50


Discuss Stocks - http://stockstobuy.org

We are finally getting that long awaited pullback in Visa stock. Support is currently located at $60 with downside to $57-$58 which would be a great buy. I would take an even bigger position if Visa ever got back between $50-$52.50. Visa is a strong company for the future and I would be buying on any huge pullbacks like we are seeing. For More Technical Analysis - Go Here

Today's Biggest Stock Market Gainers - Top 2009 Stock Gainers - Top 2009 Penny Stocks

For the latest updates on the stock market, visit, http://daytradingstockblog.blogspot.com/ or Subscribe for Free

Wednesday, April 1, 2009

Visa V Stock Analysis 4/2/09 April 2 2009

The following is technical analysis for Visa ( V ) stock for April 2, 2009.

Visa Support and Resistance Levels: 4/2/09

Resistance - $58, $60

Support - $54, $52.50, $50


Visa continues to trend along with the 10 day moving average, most importantly, above the 50 day moving average. When Visa starts to break out to the upside again, it will be a big move into the $60's. This could actually happen right before or after their next earnings report. I am waiting for a close over $58 as a sign Visa stock is ready to rock. Also, watch for a close above the 200 day moving average, this will be the first time ever! On the downside, I would be selling a close under $52.50. For More Technical Analysis - Go Here

Today's Biggest Stock Market Gainers - Top 2009 Stock Gainers - Top 2009 Penny Stocks
For the latest updates on the stock market, visit, http://daytradingstockblog.blogspot.com/ or Subscribe for Free

Saturday, January 24, 2009

Visa V Technical Analysis January 26, 2009

The following is technical & fundamental analysis for Visa ( V ) stock for 1/26/09. You can see a chart of this analysis by going to http://blackberrystocks.com/visa.html

Visa ( V ) Support and Resistance Levels:

Resistance - $47.50, $50, $52
Support - $43.50, $41.78, $40


Visa ( V ) has totally broken down and broken both low points ( $43.65 and $43.54 ) that formed the double bottom....this is very concerning and is bearish for the stock. Resistance is now at the $47.50 area and if Visa gets a close over this level, $50 will be tested. $50 is another strong resistance level but if closed above you could get buyers flowing back into the stock again. Right now, support appears to be at $42 for Visa. The problem with Visa stock is the company is so tied to the economy. With all the unknowns out there, speculating Analysts have nothing good to say about the current state of the economy and will downgrade a stock like Visa. The stock market typically turns upward six months before the economy starts to show improvement and Visa will be the first to turn with the market. My opinion - If Visa stock dips below $40 I will have to start a long position.

For the latest updates on the stock market, visit, http://daytradingstockblog.blogspot.com/ or Subscribe for Free

Saturday, December 6, 2008

Visa ( V ) Analysis 12/8/08 - Visa Technical Analysis

The following is technical analysis for Visa ( V ) stock for 12/08/08. You can find a chart of this technical analysis by visiting - http://blackberrystocks.com/visa.html

Visa ( V ) has closed over the 50 day moving average for the first time since August...this is very bullish. Pullbacks under $50 can be bought with a stop at $47. Visa has formed a double bottom around $43.60 and appears to be starting a new uptrend. Visa has resistance at $55-$57 and also $60-$62 so you have some nice gaps of upside in between. If Visa closes above $62 at any point, I think you can see Visa slowly climb back to test $70. Visa appears to have finally bottomed!

For the latest updates on the stock market, visit, http://daytradingstockblog.blogspot.com/ or Subscribe for Free

Thursday, October 23, 2008

Visa ( V ) Analysis 10/23/08 - Visa Technical Analysis

The following is technical analysis for Visa ( V ) stock for 10/23/08.

Visa ( V ) Technical Analysis:

Visa continues to be weak as we go into this recession period....V has failed to close above its 10 day moving average for awhile now. Support is at $47.50 and if that doesn't hold you could test $45 and below. I am waiting for a new low tag to form before I get long this stock. There is resistance in the low $50's up until $56......then its smooth sailing until $62.

If you are looking to take a long position...rather then trying to catch the bottom...buy V when it breaks through the highs of the day after 9:45am est, then set a stop for that high of the day. Usually when stocks break the HOD, it is for a good reason, there is buy interest. To many traders get caught trying to buy on dips only for the stock to trade lower......by the time it comes back to where you bought the stock at you are more inclined to sell into the strength, missing the move higher.
Copyright © 2008-2020 - daytradingstockblog.blogspot.com

Stocks to Buy 2020 - Click Here