Hot Stock Alerts

Potential Breakout Stocks of the Day:
Top Stocks 2021 - TSLA BYND GBTC
Top Penny Stocks 2021 - GBTC

Stock Market Closing Report - 12/8/20 December 8, 2020

Tuesday, March 24, 2009

Dow Jones Futures 3/25/09 Stock Market Futures

How will the stock market open on Wednesday - March 25, 2009? The Dow Jones and Stock Market Futures are pointing toward a higher open for pre market. Check out technical analysis for March 25th.

Stock Market Futures 3/25/09 - Pre Market Trading - Updated 7:20am EST

Dow Jones Futures - Up 7
S&P 500 Futures - Up 0.20
Nasdaq Futures - Up 2
Nikkei 8480 Down 8
Oil Futures - 52.84
Gold Futures - 922

Today's Biggest Stock Market Gainers - Top 2009 Stock Gainers - Top 2009 Penny Stocks - Baltic Dry Index

For the latest updates on the stock market, visit, http://daytradingstockblog.blogspot.com/ or Subscribe for Free

Stocks to Buy March 25, 2009 3/25/09

Tuesday, during regular trading hours, there were many stocks that continued to break out to the upside. Below is a list of stocks that are worth watching for Wednesday, March 25, 2009.
Also, check out the Biggest Stock Gainers of the Day. You can also find previous stocks to buy reports - Right Here


Stocks to Watch - 3/25/09 - Stock Market Ideas


Financials - Tonight, during afterhours trading, the financials got a bounce after selling off most of the day. Bank of America ( BAC ) led the charge with the most volume. Other notable bank stock gainers include: Financial Bull 3X ( FAS ), Citigroup ( C ), Wells Fargo ( WFC ), Fifth Third ( FITB ), American International Group ( AIG ), JP Morgan ( JPM ), Freddie Mac ( FRE ), and Fannie Mae ( FNM ).

Afterhours Gainers:

Fortress Investment Group (FIG) - $2.90 Up 17.89% - FIG stock has been going up for the past two weeks. Private Equity Soars On Geithner Plan

American Capital (ACAS) - $2.08 Up 6.67%

Penny Stocks - Since this latest rally in early March began, Penny Stocks have been exploding higher everywhere. Here is a list of hot penny stocks that were exploding higher during Tuesday's trading session. If the stock market is up tomorrow, these should see additional buying interest. Biopure (BPUR), La Jolla Pharmaceutical (LJPC), Elite Pharmaceuticals (ELI), Cell Therapeutics (CTIC), Zale Corporation (ZLC), Pier 1 Imports Inc. (PIR), Fairpoint Communications (FRP), GSI Group (GSIG), KKR Financial Holdings (KFN).

Hot Stocks over $2 - Las Vegas Sands Corp. (LVS) - Allergan (AGN) - Phillips-Van Heusen Corp. (PVH) - Emergent BioSolutions (EBS) - International Paper (IP) - UltraShort Real Estate ProShares (SRS) - Direxion Small Cap Bear 3X Shares (TZA) - SunOpta Inc. (STKL)

Today's Biggest Stock Market Gainers - Top 2009 Stock Gainers - Top 2009 Penny Stocks

For the latest updates on the stock market, visit, http://daytradingstockblog.blogspot.com/ or Subscribe for Free

Dow Jones Analysis 3/25/09 Stock Market Analysis

The following is Technical Analysis for the Dow Jones ( DJIA ) for 3/25/09

Dow Jones Support & Resistance Levels - March 25, 2009

Resistance Levels: 8000, 8250

Support Levels: 7630, 7500, 7449, 7300


The Dow Jones pulled back today but still managed to close over the 50 day moving average. This is a support level worth watching. The next support level that would have to hold would be the 7500 level. If this rally continues, I could see the Dow briefly going into the low 8000's before hitting resistance. The downtrend line will be very tough to break.

For More Technical Analysis - Go Here

Today's Biggest Stock Market Gainers - Top 2009 Stock Gainers - Top 2009 Penny Stocks - Baltic Dry Index

For the latest updates on the stock market, visit, http://daytradingstockblog.blogspot.com/ or Subscribe for Free

Dow Jones Close 3/24/09 - Stock Market Closing Prices

Stock Market Closing Prices - 3/24/09

Dow Jones Industrial Average ( DJIA ) Close - 7660.29 Down 115.57
Nasdaq Stock Market Close - 1516.94 Down 38.83
S&P 500 Close - 806.16 Down 16.76
http://dowjonesclose.com

Libor Rates - 3/24/09

Commodities Closing Prices - 3/24/09

Gold - 926.30
Oil - 53.56
Natural Gas - 4.34

The Dow Jones Industrial Average closed at 7660 on 3/24/09, as the stock market rallied off the lows during the afternoon but then sold off again just after 3pm. Nothing to exciting happened today, one day after a monster stock market rally. The Dow Jones Futures opened up weak with the Nasdaq being the weakest market. After the huge rally yesterday, this is common to have some profit taking. I continue to watch 800 on the S&P 500 as a major support level going forward. A close below 800 would bring in a lot of selling and short sellers.

Dryships ( DRYS ) finally releases earning tonight. This stock could be a huge mover in afterhours tonight and pre market trading tomorrow. Just something to keep an eye on.

I will have full technical analysis of the stock market tonight - Right Here

Today's Biggest Stock Market Gainers - Top 2009 Stock Gainers - Top 2009 Penny Stocks - Baltic Dry Index

For the latest updates on the stock market, visit, http://daytradingstockblog.blogspot.com/ or Subscribe for Free

S&P 500 Analysis 3/25/09 March 25, 2009

The following is Technical Analysis for the S&P 500 ( IXIC ) for 3/24/09, 3/25/09

S&P 500 Support & Resistance Levels - March 24, 2009, March 25, 2009

Resistance Levels: 824, 840, 868, 875

Support Levels: 810, 804, 800, 789, 770, 766


The S&P 500 broke up through and closed over 800 yesterday, this level now becomes support. As you can see from my downtrend line, the S&P still has further room to rise on a technical basis. As long as the S&P stays above 800, I could see it rising back to the 850-870 level with no problem. The minute we get a close back under 800, you need to started getting cautious as the S&P would then be testing the 50 day moving average again. Things are going to get real interesting in the next 5 or 6 trading sessions!! 800 is your line in the sand. For More Technical Analysis - Go Here

Today's Biggest Stock Market Gainers - Top 2009 Stock Gainers - Top 2009 Penny Stocks - Baltic Dry Index

For the latest updates on the stock market, visit, http://daytradingstockblog.blogspot.com/ or Subscribe for Free

FAS FAZ Stock Analysis - Trading FAS FAZ - 3/24/09

The following is technical analysis on Financial Bull ( FAS ) and Financial Bear ( FAZ ) for 3/24/09.

These two stocks are extremely volatile and if day traded correctly or even slightly correctly, could make you boat loads of money. The important thing to note is that FAS and FAZ are trading vehicles, not long term investments. Take profits quickly and regroup!


When I trade these two stocks, I always follow the stock in the uptrend and if the uptrend is broken, will help me trade the other one. In the current case, FAS is the stock I watch to tip me off on FAZ because FAS is currently in the short term uptrend. For example, yesterday when FAS was trading around $6.15, FAZ was around $26.50. Given how these two stocks work ( because they are inverse and reset each day ), the huge move yesterday really hurt FAZ. Because of the huge move up in FAS late yesterday, If FAS would go back to $6.15 today, FAZ would only be at $23 or so. On March 6th, when the stock market was hitting the lows, FAZ was trading at $104.60 while FAS was at $2.70. If FAS would have went down $0.20, FAZ would have went up $10 per share.

FAS Technical Analysis:

FAS has resistance from the other day at $7.80, if FAS breaks out through $7.80, I believe it could make a run back toward $10. This would sink FAZ and send it back into the single digits. The 50 day moving average on FAS is currently at $7.60 and is going down everyday. This will be a big resistance level in addition to the $7.80 high. FAS has solid support between $6.00-$6.31. If FAS would break $6, this would give me a technical signal to get back into FAZ, but you would still want to keep watching FAS that particular day. So in short, I am watching $7.80 and $6.00-$6.31 on FAS.

Hopefully this helps and doesn't confuse people, but this has been very successful for me. It is very important to know how these ETF's work, especially the 3 to 1 levered ETF's. If not, you could get really crushed!! Since these two stocks are highly levered ETF's, there is really no need to take huge position!! Small positions can make you nice profits.

What is FAS and FAZ?

Financial Bull 3x ( FAS ) - The investment seeks to replicate, net of expenses, 300% of the daily performance of the Russell 1000 Financial Services Index( ie, Long Position ). The fund will invest at least 80% of assets in securities that comprise the index. It will also utilize financial instruments that, in combination, provide leveraged and unleveraged exposure to the index. The fund is nondiversified.

Financial Bear 3x ( FAZ ) - The investment seeks to replicate, net of expenses, 300% of the inverse daily performance of the Russell 1000 Financial Services Index. (ie, Short Position ). The fund will invest at least 80% of assets in securities that comprise the index. It will also utilize financial instruments that, in combination, provide leveraged and unleveraged exposure to the index. The fund is nondiversified.


Today's Biggest Stock Market Gainers - Top 2009 Stock Gainers - Top 2009 Penny Stocks
For the latest updates on the stock market, visit, http://daytradingstockblog.blogspot.com/ or Subscribe for Free

Biggest Stock Gainers 3/24/09 March 24, 2009

Today, March 24, 2009, there are several stock gainers that are breaking out with some nice momentum. If you are looking to day trade today, you might want to check out the following stocks. Check out today's biggest gainers and the Top Stocks for 2009. You can find yesterday's Top Gainers Report Right Here

Hot Stocks 3/24/09 - Biggest Gainers Today

Fortress Investment Group (FIG) - $2.70 Up 29.19% - Private Equity Soars On Geithner Plan.

Blackstone Group (BX) - $8.96 Up 14.72% - Private Equity Soars On Geithner Plan.

Allergan (AGN) - $49.01 up 13.76% - Allergan Call-Buying Surges, Options Show

DrysShips (DRYS) - $5.54 Up 13.06% - Drys is FINALLY going to release earnings tonight - 3/24/09. Short covering before earnings is what this is. If this earnings report isn't a disaster tonight, DRYS could move back into the $7.00 - $10.00 area shortly in my opinion!

Other Stock Gainers over $2.00

PetroQuest Energy (PQ)
Excel Maritime Carriers (EXM)
Phillips-Van Heusen (PVH)
Las Vegas Sands (LVS)
International Paper (IP)
Palm (PALM)

Today's Biggest Stock Market Gainers - Top 2009 Stock Gainers - Top 2009 Penny Stocks

For the latest updates on the stock market, visit, http://daytradingstockblog.blogspot.com/ or Subscribe for Free

Hot Penny Stocks 3/24/09 March 24, 2009

Today, 3/24/09, there are a few penny stock gainers breaking out to the upside. Be sure to check out the Top 2009 Penny Stock Gainers on the NYSE, Nasdaq, and AMEX. We tend to stay away from OTC and Pink Sheets stocks, especially in this environment! You can find ALL Penny Stock Reports Here

Penny Stock Gainers - March 24, 2009

Elite Pharmaceuticals (ELI) - $0.27 Up 107.69% - ELI Announces Signing of Strategic Alliance Agreement; Notification Received From NYSE Amex.

Pier 1 Imports (PIR) - $0.86 up 43.35% - PIR continues to surge after we spotted this in afterhours Friday night at $0.30. Pier 1 could shut 80 stores as it posts losses.

Empire Resorts (NYNY) - $0.92 Up 31.43% - Empire Resorts Announces Twin Gaming Venues at Monticello Raceway and Concord Hotel & Resort.

Other Big Penny Stock Gainers 3/24/09

Champion Enterprises Inc. (CHB)
Advanced Environmental Recycling Technologies (AERT)
Air Transport Services Group (ATSG) - On Top 2009 Penny Stocks List
American Capital (ACAS)
Altair Nanotechnologies (ALTI)
Biopure (BPUR)
Corus Bankshares (CORS)
Image Entertainment (DISK)

Today's Biggest Stock Market Gainers - Top 2009 Stock Gainers - Top 2009 Penny Stocks

For the latest updates on the stock market, visit, http://daytradingstockblog.blogspot.com/ or Subscribe for Free

Baltic Dry Index Shipping Rates 3/24/09 BDI

The following is a report on Dry Bulk Shipping Rates for 3/24/09. This data is critical for how the DryBulk Shipping Stocks such as DryShips ( DRYS ), Excel Maritime Carriers ( EXM ), Diana Shipping ( DSX ), Genco Shipping ( GNX ), TBS International ( TBSI ), Navios Maritime ( NM ), and OceanFreight ( OCNF ) will trade during the day. As you probably know, the Dry Bulk Shipping index can tell you a lot about the state of the World Economy. When Bulk Shipping Rates are at all time highs, the World Economy is outstanding. When Bulk Shipping Rates are as low as they have been lately, it signifies that the world economy has come to a screeching halt!
http://dryindex.com/

Dry Bulk Shipping Rates - March 24, 2009 - Down 10 Straight Days

Baltic Dry Index ( BDI ) - 1758 Down 15
Spot 4 - TC Average - 19909 Down 288
Baltic Cape Index ( BCI ) - 2195 Down 20
Baltic Panamax Index ( BPI ) - 1526 Up 37
Supramax Index ( BSI ) - 1437 Down 56
Past Bulk Shipping Rates

For More Stock Market Updates, visit , http://daytradingstockblog.blogspot.com/ or Subscribe for FREE

Art Cashin CNBC 3/24/09 March 24, 2009

Art Cashin was on CNBC this morning, March 24, 2009 - and gave some comments about the explosive rally we saw yesterday. Art Cashin came on CNBC around 2:30pm and said yesterday's stock market rally would either start to fade or we will have a fireworks explosion to the upside. The Dow Jones ended up going up an additional 200 points!

Art Cashin Comments -3/24/09

How impressive was the rally?

It was a stand out day, 97% of nyse stocks traded up, the VIX didn't pullback, but you can't take anything away from the rally. This current rally ranks in the Top 10 rallies. We punched through 804 resistance on the S&P 500, we are now overbought, we will have to rest here and wait to see what comes out of Washington.

Toxic Asset Comments:

Will the sellers sell at low prices?

If they sell, what will they do with the money? Probably pay the TARP back as quick as they can, they don't want the mother in the kitchen ( Washington ). Goldman Sachs came out yesterday and said they would do this.

For all of Art's Comments, go here

For the latest updates on the stock market, visit, http://daytradingstockblog.blogspot.com/ or Subscribe for Free

GE Stock Analysis 3/24/09 March 24, 2009

The following is technical analysis of General Electric ( GE ) stock for March 24, 2009.

GE Support & Resistance Levels - March 24, 2009

Resistance Levels: $10.69, $11.35

Support Levels: $9.66, $9.00, $8.00, $6.65


The GE stock technicals don't look as good as the other charts but General Electric has certainly come a long way. The 10 day moving average has held and offers a solid support level going forward. I would love to see GE stock get over the 50 day moving average and hold for a few days, this would be very bullish. If I was trading or buying GE, I would be placing a stop loss order at support around $9.65 and selling any close below the 10 day moving average from here on out. This would be your first signal that the rally is fading. I would be buying a break above $11.35 resistance with a stop at the 50 day moving average. For More Technical Analysis - Go Here

Today's Biggest Stock Market Gainers - Top 2009 Stock Gainers - Top 2009 Penny Stocks

For the latest updates on the stock market, visit, http://daytradingstockblog.blogspot.com/ or Subscribe for Free

BAC Stock Analysis 3/24/09 March 24 2009

The following is a Bank of America ( BAC ) stock technical analysis for March 24, 2009.

Bank of America Support & Resistance Levels - 3/24/09

Resistance Levels: $7.00, $7.50, $8.57

Support Levels: $5.95, $5.00


Bank of America stock has closed over the 50 day moving average for the past 4 days, very bullish. As you can see, the 10 day moving average is crossing the 50 day moving average, something that hasn't happened since last July....this is very bullish going forward. As for trading BAC stock, I would now be trading off the 10 day moving average. Pullbacks into the low $6's can be bought for a bounce but keep in mind, the 10 day moving average will move higher each day given the recent move. Right now it is at $6.24. A close below this level at any time would be concerning. On the upside, a break above $8.57 would be huge and is a sign the buying fenzy will continue. B of A appears to have finally formed a stock bottom in the $2's.

For More Technical Analysis - Go Here

Today's Biggest Stock Market Gainers - Top 2009 Stock Gainers - Top 2009 Penny Stocks

For the latest updates on the stock market, visit, http://daytradingstockblog.blogspot.com/ or Subscribe for Free

AIG Stock Analysis March 24, 2009 3/24/09
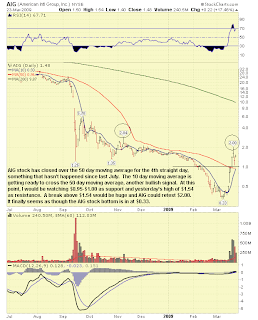
The following is technical analysis on American International Group ( AIG ) stock for March 24, 2009.

AIG Support & Resistance Levels - 3/24/09

Resistance Levels: $2.00, $2.12

Support Levels: $1.06, $1.00


AIG stock has closed over the 50 day moving average for the 4th straight day, something that hasn't happened since last July. The 10 day moving average is getting ready to cross the 50 day moving average, another bullish signal. At this point, I would be watching $0.95-$1.00 as support and yesterday's high of $1.54 as resistance. A break above $1.54 would be huge and AIG could retest $2.00. It finally seems as though the AIG stock bottom is in at $0.33. For More Technical Analysis - Go Here

Today's Biggest Stock Market Gainers - Top 2009 Stock Gainers - Top 2009 Penny Stocks

For the latest updates on the stock market, visit, http://daytradingstockblog.blogspot.com/ or Subscribe for Free

1 and 3 Month Libor Rates - 3/24/09 - Today's Libor Rates

It seems as though everyone is watching Libor rates these days. Today's Libor Rates for 3/24/09, are: 1 Month Libor Rate - 0.521%. & 3 Month Libor Rate - 1.226%. The overnight Libor rate is 0.286%. As you can see, Libor Rates have changed today, March 24th, 2009. The Overnight and 3 Month Libor went up while the 1 Month Libor fell.

Here are Previous Libor rates. You can also compare Libor Rates to how the Dow Jones traded.

For the latest updates on the stock market, visit, http://daytradingstockblog.blogspot.com/ or Subscribe for Free

Citigroup C Stock 3/24/09 March 24, 2009
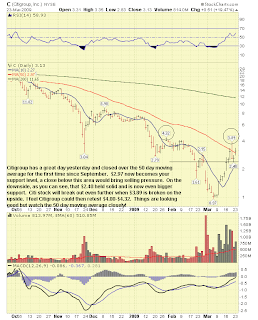
The following is a little Citigroup ( C ) stock technical analysis for March 24, 2009.

Citigroup Support & Resistance Levels - 3/24/09

Resistance Levels: $3.35, $3.89

Support Levels: $2.97, $2.40, $2.20, $2.00


Citigroup has a great day yesterday and closed over the 50 day moving average for the first time since September. $2.97 now becomes your support level, a close below this area would bring selling pressure. On the downside, as you can see, that $2.40 held solid and is now even bigger support. Citi stock will break out even further when $3.89 is broken on the upside. I feel Citigroup could then retest $4.00-$4.32. Things are looking good but watch the 50 day moving average closely!

For More Technical Analysis - Go Here

Today's Biggest Stock Market Gainers - Top 2009 Stock Gainers - Top 2009 Penny Stocks

For the latest updates on the stock market, visit, http://daytradingstockblog.blogspot.com/ or Subscribe for Free
Copyright © 2008-2020 - daytradingstockblog.blogspot.com

Stocks to Buy 2020 - Click Here