 Visa V Stock Chart Analysis - The following is technical analysis for Visa Inc. (NYSE:V) stock for August 28, 2009.
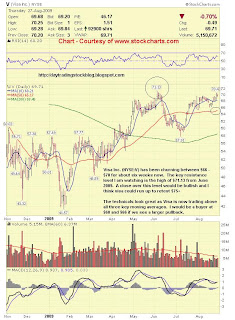
Visa Support and Resistance Levels: 8/28/09
Resistance - $70.43, $71.13, $75
Support - $68, $66
http://stockcharts.com/ - Chart
Discuss Stocks - http://stockstobuy.org
Visa Inc. (NYSE:V) has been churning between $66 - $70 for about six weeks now. The key resistance level I am watching is the high of $71.13 from June 2009. A close over this level would be bullish and I think visa could run up to retest $75+
The technicals look great as Visa is now trading above all three key moving averages. I would be a buyer at $68 and $66 if we see a larger pullback.
For More Technical Analysis - Go Here
For the latest updates on the stock market, visit, http://daytradingstockblog.blogspot.com/ or Subscribe for Free