October 22, 2013 - Netflix (NFLX) stock was upgraded today with a 2014 price target of $440. Shares of Netflix (NFLX) are trading at $394, up 11%, after the company reported blow out earnings last night. Netflix also raised guidance for 2014 and they see a lot more profits in their futures.
Should you buy Netflix (NFLX) stock? On Wall St., it's all about earnings and future earnings and the stock should do well for the next 3 months. However, I would avoid it after that. While NFLX shares are doing well, there are plenty of other stocks worth buying. I like NDLS, RH, YELP, PBPB, AAPL, and GOOG.
For more information in the top stocks in 2014, visit these links - Stocks 2014 - Top Penny Stocks 2014 - Stocks to Buy 2014
Showing posts with label opinions. Show all posts
Showing posts with label opinions. Show all posts
Tuesday, October 22, 2013
Tuesday, September 18, 2012
Facebook (FB) Stock Analysis September 18, 2012
 By Tim - http://stockstobuy.org - Twitter - @stockstobuy -
 Facebook (FB) Stock Chart - The following is technical analysis on Facebook (FB) - September 18, 2012
Facebook (FB) Support & Resistance Levels - 9/18/12
Resistance Levels: $22.75
Support Levels: $20
Chart - http://www.stockcharts.com
Facebook (FB) stock failed at the 50 day moving average on Monday and closed down for the day. Facebook (FB) will have support down around $21 as we go forward. FB will have resistance at $22.75. Facebook (FB) is a buy below $20 for a bounce trade. Facebook (FB) should break out again when the stock breaks above $22.75.
Today's Stock Gainers - Today's Stock Losers - 2012 Stock Picks - 2012 Penny Stocks - 2012 Stocks to Buy - Day Trading Tips - Stock Trading Rules
Monday, September 17, 2012
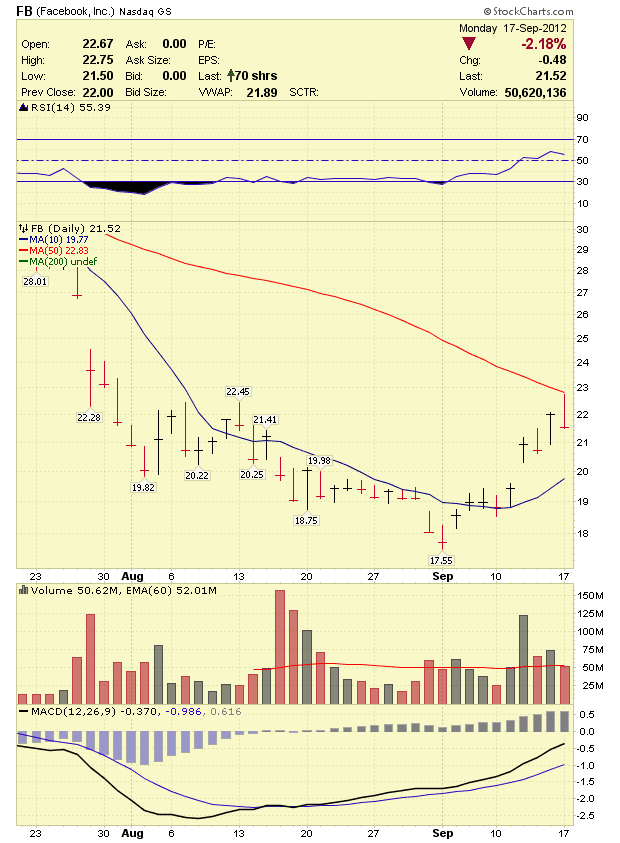
Facebook (FB) Stock Analysis September 17, 2012
By Tim - http://stockstobuy.org - Twitter - @stockstobuy - Facebook (FB) Stock Chart - The following is technical analysis on Facebook (FB) - September 17, 2012
Facebook (FB) Support & Resistance Levels - 9/17/12
Resistance Levels: $22.75
Support Levels: $20
Chart - http://www.stockcharts.com
Facebook (FB) stock failed at the 50 day moving average on Monday and closed down for the day. Facebook (FB) will have support down around $21 as we go forward. FB will have resistance at $22.75. Facebook (FB) is a buy below $20 for a bounce trade. Facebook (FB) should break out again when the stock breaks above $22.75.
Today's Stock Gainers - Today's Stock Losers - 2012 Stock Picks - 2012 Penny Stocks - 2012 Stocks to Buy - Day Trading Tips - Stock Trading Rules
Tuesday, July 31, 2012
Facebook (FB) Stock Analysis July 31, 2012
 By Tim - http://stockstobuy.org - Twitter - @stockstobuy -
 Facebook (FB) Stock Chart - The following is technical analysis on Facebook (FB) - July 31, 2012
Facebook (FB) Support & Resistance Levels - 7/31/12
Resistance Levels: $24.54
Support Levels: $23
Chart - http://www.stockcharts.com
Facebook (FB) stock dropped again on Monday. Facebook (FB) will have support down around $23 as we go forward. FB will have resistance at $25. Facebook (FB) is a buy below $21 for a bounce trade. Facebook (FB) should break out again when the stock breaks above $24.54
Today's Stock Gainers - Today's Stock Losers - 2012 Stock Picks - 2012 Penny Stocks - 2012 Stocks to Buy - Day Trading Tips - Stock Trading Rules
Monday, July 30, 2012
Facebook (FB) Stock Analysis July 30, 2012
 By Tim - http://stockstobuy.org - Twitter - @stockstobuy -
 Facebook (FB) Stock Chart - The following is technical analysis on Facebook (FB) - July 30, 2012
Facebook (FB) Support & Resistance Levels - 7/30/12
Resistance Levels: $24.54
Support Levels: $23
Chart - http://www.stockcharts.com
Facebook (FB) stock crashed after the company reported inline earnings. Facebook (FB) will have support down around $23 as we go forward. FB will have resistance at $25. Facebook (FB) is a buy below $21 for a bounce trade. Facebook (FB) should break out again when the stock breaks above $24.54
Today's Stock Gainers - Today's Stock Losers - 2012 Stock Picks - 2012 Penny Stocks - 2012 Stocks to Buy - Day Trading Tips - Stock Trading Rules
Sunday, July 29, 2012
Facebook (FB) Stock Analysis 7/30/12
By Tim - http://stockstobuy.org - Twitter - @stockstobuy - Facebook (FB) Stock Chart - The following is technical analysis on Facebook (FB) - July 30, 2012
Facebook (FB) Support & Resistance Levels - 7/30/12
Resistance Levels: $24.54
Support Levels: $23
Chart - http://www.stockcharts.com
Facebook (FB) stock crashed after the company reported inline earnings. Facebook (FB) will have support down around $23 as we go forward. FB will have resistance at $25. Facebook (FB) is a buy below $21 for a bounce trade. Facebook (FB) should break out again when the stock breaks above $24.54
Today's Stock Gainers - Today's Stock Losers - 2012 Stock Picks - 2012 Penny Stocks - 2012 Stocks to Buy - Day Trading Tips - Stock Trading Rules
Thursday, July 26, 2012
Facebook (FB) Stock Analysis July 26, 2012
 By Tim - http://stockstobuy.org - Twitter - @stockstobuy -
 Facebook (FB) Stock Chart - The following is technical analysis on Facebook (FB) - July 26, 2012
Facebook (FB) Support & Resistance Levels - 7/26/12
Resistance Levels: $29.25
Support Levels: $27
Chart - http://www.stockcharts.com
Facebook (FB) stock dropped back below $28 today ahead of earnings. Facebook (FB) is expected to report earnings of $0.12 on $1.15 billion in revenue (more...). FB will have resistance at $30. Facebook (FB) is a buy below $27 for the long term. I think Facebook will rally back into the $30's at some point soon.
Today's Stock Gainers - Today's Stock Losers - 2012 Stock Picks - 2012 Penny Stocks - 2012 Stocks to Buy - Day Trading Tips - Stock Trading Rules
Monday, July 23, 2012
Facebook (FB) Stock Analysis July 23, 2012
 By Tim - http://stockstobuy.org - Twitter - @stockstobuy -
 Facebook (FB) Stock Chart - The following is technical analysis on Facebook (FB) - July 23, 2012
Facebook (FB) Support & Resistance Levels - 7/23/12
Resistance Levels: $30.70
Support Levels: $27
Chart - http://www.stockcharts.com
Facebook (FB) stock dropped below $28 last week. Facebook (FB) will have support down around $27 ahead of earnings this week. FB will have resistance at $30. Facebook (FB) is a buy below $27 for the long term. I think Facebook has hit a bottom ahead of earnings on July 26, 2012.
Today's Stock Gainers - Today's Stock Losers - 2012 Stock Picks - 2012 Penny Stocks - 2012 Stocks to Buy - Day Trading Tips - Stock Trading Rules
Sunday, July 22, 2012
Facebook (FB) Stock Analysis 7/23/12
By Tim - http://stockstobuy.org - Twitter - @stockstobuy - Facebook (FB) Stock Chart - The following is technical analysis on Facebook (FB) - July 23, 2012
Facebook (FB) Support & Resistance Levels - 7/23/12
Resistance Levels: $30.70
Support Levels: $27
Chart - http://www.stockcharts.com
Facebook (FB) stock dropped below $28 last week. Facebook (FB) will have support down around $27 ahead of earnings this week. FB will have resistance at $30. Facebook (FB) is a buy below $27 for the long term. I think Facebook has hit a bottom ahead of earnings on July 26, 2012.
Today's Stock Gainers - Today's Stock Losers - 2012 Stock Picks - 2012 Penny Stocks - 2012 Stocks to Buy - Day Trading Tips - Stock Trading Rules
Tuesday, July 17, 2012
Facebook (FB) Stock Analysis 7/17/12
 By Tim - http://stockstobuy.org - Twitter - @stockstobuy -
 Facebook (FB) Stock Chart - The following is technical analysis on Facebook (FB) - July 17, 2012
Facebook (FB) Support & Resistance Levels - 7/17/12
Resistance Levels: $32.88
Support Levels: $28.50
Chart - http://www.stockcharts.com
Facebook (FB) stock dropped back below $30 on Monday. Facebook (FB) will have support down around $28.50. FB will have resistance at $29.50. Facebook (FB) is a buy below $27 for the long term. Facebook will report earnings on July 26, 2012.
Today's Stock Gainers - Today's Stock Losers - 2012 Stock Picks - 2012 Penny Stocks - 2012 Stocks to Buy - Day Trading Tips - Stock Trading Rules
Monday, July 16, 2012
Facebook (FB) Stock Analysis 7/16/12
 By Tim - http://stockstobuy.org - Twitter - @stockstobuy -
 Facebook (FB) Stock Chart - The following is technical analysis on Facebook (FB) - July 16, 2012
Facebook (FB) Support & Resistance Levels - 7/16/12
Resistance Levels: $32.88
Support Levels: $28.50
Chart - http://www.stockcharts.com
Facebook (FB) stock is still hanging out below $31. Facebook (FB) will have support down around $30 but then nothing until $28.50. FB will have resistance at $32.88. Facebook (FB) is a buy below $27 for the long term. I think Facebook has hit a bottom ahead of earnings on July 26, 2012.
Today's Stock Gainers - Today's Stock Losers - 2012 Stock Picks - 2012 Penny Stocks - 2012 Stocks to Buy - Day Trading Tips - Stock Trading Rules
Sunday, July 15, 2012
Facebook (FB) Stock Analysis July 16, 2012
By Tim - http://stockstobuy.org - Twitter - @stockstobuy - Facebook (FB) Stock Chart - The following is technical analysis on Facebook (FB) - July 16, 2012
Facebook (FB) Support & Resistance Levels - 7/16/12
Resistance Levels: $32.88
Support Levels: $28.50
Chart - http://www.stockcharts.com
Facebook (FB) stock is still hanging out below $31. Facebook (FB) will have support down around $30 but then nothing until $28.50. FB will have resistance at $32.88. Facebook (FB) is a buy below $27 for the long term. I think Facebook has hit a bottom ahead of earnings on July 26, 2012.
Today's Stock Gainers - Today's Stock Losers - 2012 Stock Picks - 2012 Penny Stocks - 2012 Stocks to Buy - Day Trading Tips - Stock Trading Rules
Monday, July 9, 2012
Facebook (FB) Stock Analysis July 9, 2012
 By Tim - http://stockstobuy.org - Twitter - @stockstobuy -
 Facebook (FB) Stock Chart - The following is technical analysis on Facebook (FB) - July 9, 2012
Facebook (FB) Support & Resistance Levels - 7/9/12
Resistance Levels: $33.45
Support Levels: $30
Chart - http://www.stockcharts.com
Facebook (FB) stock is still hanging out in the $31's. Facebook (FB) will have support down around $30. FB will have resistance at $33.45. Facebook (FB) is a buy below $27 for the long term. I think Facebook has hit a bottom ahead of earnings in July 2012.
Today's Stock Gainers - Today's Stock Losers - 2012 Stock Picks - 2012 Penny Stocks - 2012 Stocks to Buy - Day Trading Tips - Stock Trading Rules
Sunday, July 8, 2012
Facebook (FB) Stock Analysis 7/9/12
By Tim - http://stockstobuy.org - Twitter - @stockstobuy - Facebook (FB) Stock Chart - The following is technical analysis on Facebook (FB) - July 9, 2012
Facebook (FB) Support & Resistance Levels - 7/9/12
Resistance Levels: $33.45
Support Levels: $30
Chart - http://www.stockcharts.com
Facebook (FB) stock is still hanging out in the $31's. Facebook (FB) will have support down around $30. FB will have resistance at $33.45. Facebook (FB) is a buy below $27 for the long term. I think Facebook has hit a bottom ahead of earnings in July 2012.
Today's Stock Gainers - Today's Stock Losers - 2012 Stock Picks - 2012 Penny Stocks - 2012 Stocks to Buy - Day Trading Tips - Stock Trading Rules
Tuesday, July 3, 2012
Facebook (FB) Stock Analysis July 3, 2012
 By Tim - http://stockstobuy.org - Twitter - @stockstobuy -
 Facebook (FB) Stock Chart - The following is technical analysis on Facebook (FB) - July 3, 2012
Facebook (FB) Support & Resistance Levels - 7/3/12
Resistance Levels: $31.73
Support Levels: $30
Chart - http://www.stockcharts.com
Facebook (FB) stock is breaking down after a huge rally in June. Facebook (FB) will have support down around $30. FB will have resistance at $31.73. Facebook (FB) is a buy below $27 for the long term. I think Facebook has hit a bottom ahead of earnings in July 2012.
Today's Stock Gainers - Today's Stock Losers - 2012 Stock Picks - 2012 Penny Stocks - 2012 Stocks to Buy - Day Trading Tips - Stock Trading Rules
Monday, July 2, 2012
Facebook (FB) Technical Analysis July 2012
 By Tim - http://stockstobuy.org - Twitter - @stockstobuy -
 Facebook (FB) Stock Chart - The following is technical analysis on Facebook (FB) - July 2, 2012
Facebook (FB) Support & Resistance Levels - 7/2/12
Resistance Levels: $33.45
Support Levels: $30.70
Chart - http://www.stockcharts.com
Facebook (FB) stock dropped last week after a monster rally in the stock market. Facebook (FB) will have support down around $30.70. FB will have resistance at $33.45. Facebook (FB) is a buy below $27 for the long term. I think Facebook has hit a bottom ahead of earnings in July 2012.
Today's Stock Gainers - Today's Stock Losers - 2012 Stock Picks - 2012 Penny Stocks - 2012 Stocks to Buy - Day Trading Tips - Stock Trading Rules
Saturday, June 30, 2012
Facebook (FB) Stock Analysis July 2, 2012
By Tim - http://stockstobuy.org - Twitter - @stockstobuy - Facebook (FB) Stock Chart - The following is technical analysis on Facebook (FB) - July 2, 2012
Facebook (FB) Support & Resistance Levels - 7/2/12
Resistance Levels: $33.45
Support Levels: $30.70
Chart - http://www.stockcharts.com
Facebook (FB) stock dropped last week after a monster rally in the stock market. Facebook (FB) will have support down around $30.70. FB will have resistance at $33.45. Facebook (FB) is a buy below $27 for the long term. I think Facebook has hit a bottom ahead of earnings in July 2012.
Today's Stock Gainers - Today's Stock Losers - 2012 Stock Picks - 2012 Penny Stocks - 2012 Stocks to Buy - Day Trading Tips - Stock Trading Rules
Thursday, June 28, 2012
Facebook (FB) Stock Analysis June 28, 2012
 By Tim - http://stockstobuy.org - Twitter - @stockstobuy -
 Facebook (FB) Stock Chart - The following is technical analysis on Facebook (FB) - June 28, 2012
Facebook (FB) Support & Resistance Levels - 6/28/12
Resistance Levels: $33.45
Support Levels: $30.70
Chart - http://www.stockcharts.com
Facebook (FB) stock is now retesting the 10 day moving average. Facebook (FB) will have support down around $30.70. FB will have resistance at $33.45. Facebook (FB) is a buy below $27 for the long term. I think Facebook has hit a bottom ahead of earnings in July 2012.
Today's Stock Gainers - Today's Stock Losers - 2012 Stock Picks - 2012 Penny Stocks - 2012 Stocks to Buy - Day Trading Tips - Stock Trading Rules
Wednesday, June 27, 2012
Facebook (FB) Stock Analysis June 27, 2012
 By Tim - http://stockstobuy.org - Twitter - @stockstobuy -
 Facebook (FB) Stock Chart - The following is technical analysis on Facebook (FB) - June 27, 2012
Facebook (FB) Support & Resistance Levels - 6/27/12
Resistance Levels: $33.45
Support Levels: $30.70
Chart - http://www.stockcharts.com
Facebook (FB) stock continues to trade very strong. Facebook (FB) will now have support down around $30.70. FB will have resistance at $33.45. Facebook (FB) is a buy below $27 for the long term. I think Facebook has hit a bottom ahead of earnings in July 2012.
Today's Stock Gainers - Today's Stock Losers - 2012 Stock Picks - 2012 Penny Stocks - 2012 Stocks to Buy - Day Trading Tips - Stock Trading Rules
Tuesday, June 26, 2012
Facebook (FB) Stock Analysis June 26, 2012
 By Tim - http://stockstobuy.org - Twitter - @stockstobuy -
 Facebook (FB) Stock Chart - The following is technical analysis on Facebook (FB) - June 26, 2012
Facebook (FB) Support & Resistance Levels - 6/26/12
Resistance Levels: $33.45
Support Levels: $30.70
Chart - http://www.stockcharts.com
Facebook (FB) stock continues to be very strong. Facebook (FB) will now have support down around $30.70. FB will have resistance at $33.45. Facebook (FB) is a buy below $27 for the long term. I think Facebook has hit a bottom ahead of earnings in July 2012.
Today's Stock Gainers - Today's Stock Losers - 2012 Stock Picks - 2012 Penny Stocks - 2012 Stocks to Buy - Day Trading Tips - Stock Trading Rules
Subscribe to:
Posts (Atom)