Day Trading - A guide to trading stocks! - @stockstobuy -
Day Trading is short term trading of shares of stock. Day Trading can be very lucrative if you follow several keys rules and remain disciplined. Day Traders usually buy and sell stocks quickly through out the day and avoid holding a stock overnight.
Day Trading Rules:
1. Don't hold stocks overnight
- If your are hardcore day trader, you want to avoid holding stocks overnight. Events can happen overnight that cause the stock market to drop. This will most likely cause individual stocks to drop as well. Day Trading is all about making trades during the day and coming into the next day fully in cash and ready to trade the next opportunity.
2. Buy break out stocks
- Only buy when a stock has volume and news surrounding the rise in price. After the open, a stock will set a high and a low. Buy the stock if it's breaking up through the high and sell into the rally. This day trading tip has the highest success rate because when a stock is breaking through the high of the day, the computers on wall st are programmed to buy as well. If you can't beat them, join them!
3. Cut losses quickly
- If you buy a stock and it just won't rise but is dropping or you are holding it for a small loss, sell it. Cut your losers and let your winners run.
For more day trading tips and to receive my pre market newsletter, join my stock picks group. For more information in the top stocks in 2014, visit these links - Stocks 2014 - Top Penny Stocks 2014 - Stocks to Buy 2014
Showing posts with label day trading. Show all posts
Showing posts with label day trading. Show all posts
Saturday, November 9, 2013
Tuesday, September 18, 2012
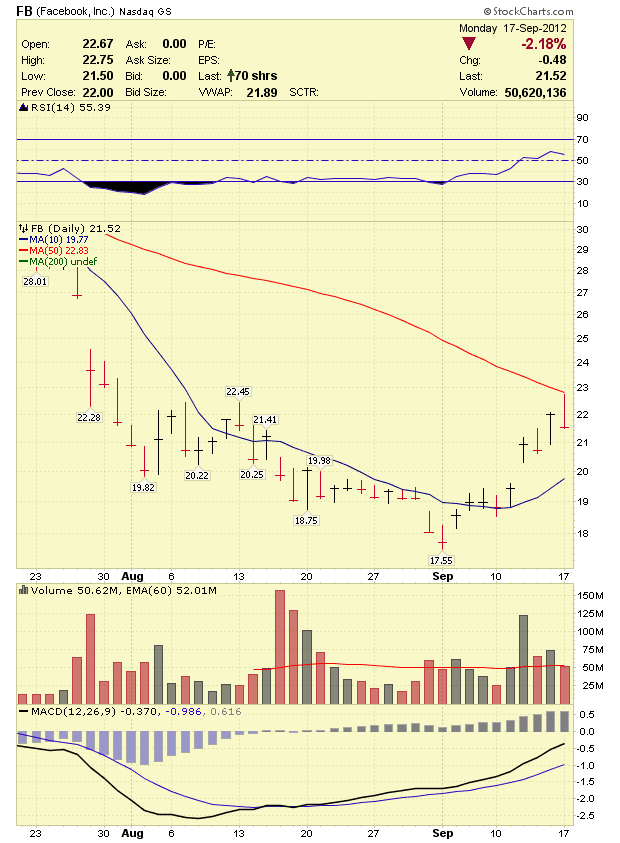
Facebook (FB) Stock Analysis September 18, 2012
 By Tim - http://stockstobuy.org - Twitter - @stockstobuy -
 Facebook (FB) Stock Chart - The following is technical analysis on Facebook (FB) - September 18, 2012
Facebook (FB) Support & Resistance Levels - 9/18/12
Resistance Levels: $22.75
Support Levels: $20
Chart - http://www.stockcharts.com
Facebook (FB) stock failed at the 50 day moving average on Monday and closed down for the day. Facebook (FB) will have support down around $21 as we go forward. FB will have resistance at $22.75. Facebook (FB) is a buy below $20 for a bounce trade. Facebook (FB) should break out again when the stock breaks above $22.75.
Today's Stock Gainers - Today's Stock Losers - 2012 Stock Picks - 2012 Penny Stocks - 2012 Stocks to Buy - Day Trading Tips - Stock Trading Rules


Monday, September 17, 2012
Facebook (FB) Stock Analysis September 17, 2012
By Tim - http://stockstobuy.org - Twitter - @stockstobuy - Facebook (FB) Stock Chart - The following is technical analysis on Facebook (FB) - September 17, 2012
Facebook (FB) Support & Resistance Levels - 9/17/12
Resistance Levels: $22.75
Support Levels: $20
Chart - http://www.stockcharts.com
Facebook (FB) stock failed at the 50 day moving average on Monday and closed down for the day. Facebook (FB) will have support down around $21 as we go forward. FB will have resistance at $22.75. Facebook (FB) is a buy below $20 for a bounce trade. Facebook (FB) should break out again when the stock breaks above $22.75.
Today's Stock Gainers - Today's Stock Losers - 2012 Stock Picks - 2012 Penny Stocks - 2012 Stocks to Buy - Day Trading Tips - Stock Trading Rules
Tuesday, July 31, 2012
Facebook (FB) Stock Analysis July 31, 2012
 By Tim - http://stockstobuy.org - Twitter - @stockstobuy -
 Facebook (FB) Stock Chart - The following is technical analysis on Facebook (FB) - July 31, 2012
Facebook (FB) Support & Resistance Levels - 7/31/12
Resistance Levels: $24.54
Support Levels: $23
Chart - http://www.stockcharts.com
Facebook (FB) stock dropped again on Monday. Facebook (FB) will have support down around $23 as we go forward. FB will have resistance at $25. Facebook (FB) is a buy below $21 for a bounce trade. Facebook (FB) should break out again when the stock breaks above $24.54
Today's Stock Gainers - Today's Stock Losers - 2012 Stock Picks - 2012 Penny Stocks - 2012 Stocks to Buy - Day Trading Tips - Stock Trading Rules
Monday, July 30, 2012
Facebook (FB) Stock Analysis July 30, 2012
 By Tim - http://stockstobuy.org - Twitter - @stockstobuy -
 Facebook (FB) Stock Chart - The following is technical analysis on Facebook (FB) - July 30, 2012
Facebook (FB) Support & Resistance Levels - 7/30/12
Resistance Levels: $24.54
Support Levels: $23
Chart - http://www.stockcharts.com
Facebook (FB) stock crashed after the company reported inline earnings. Facebook (FB) will have support down around $23 as we go forward. FB will have resistance at $25. Facebook (FB) is a buy below $21 for a bounce trade. Facebook (FB) should break out again when the stock breaks above $24.54
Today's Stock Gainers - Today's Stock Losers - 2012 Stock Picks - 2012 Penny Stocks - 2012 Stocks to Buy - Day Trading Tips - Stock Trading Rules
Sunday, July 29, 2012
Facebook (FB) Stock Analysis 7/30/12
By Tim - http://stockstobuy.org - Twitter - @stockstobuy - Facebook (FB) Stock Chart - The following is technical analysis on Facebook (FB) - July 30, 2012
Facebook (FB) Support & Resistance Levels - 7/30/12
Resistance Levels: $24.54
Support Levels: $23
Chart - http://www.stockcharts.com
Facebook (FB) stock crashed after the company reported inline earnings. Facebook (FB) will have support down around $23 as we go forward. FB will have resistance at $25. Facebook (FB) is a buy below $21 for a bounce trade. Facebook (FB) should break out again when the stock breaks above $24.54
Today's Stock Gainers - Today's Stock Losers - 2012 Stock Picks - 2012 Penny Stocks - 2012 Stocks to Buy - Day Trading Tips - Stock Trading Rules
Thursday, July 26, 2012
Facebook (FB) Stock Analysis July 26, 2012
 By Tim - http://stockstobuy.org - Twitter - @stockstobuy -
 Facebook (FB) Stock Chart - The following is technical analysis on Facebook (FB) - July 26, 2012
Facebook (FB) Support & Resistance Levels - 7/26/12
Resistance Levels: $29.25
Support Levels: $27
Chart - http://www.stockcharts.com
Facebook (FB) stock dropped back below $28 today ahead of earnings. Facebook (FB) is expected to report earnings of $0.12 on $1.15 billion in revenue (more...). FB will have resistance at $30. Facebook (FB) is a buy below $27 for the long term. I think Facebook will rally back into the $30's at some point soon.
Today's Stock Gainers - Today's Stock Losers - 2012 Stock Picks - 2012 Penny Stocks - 2012 Stocks to Buy - Day Trading Tips - Stock Trading Rules
Monday, July 23, 2012
Facebook (FB) Stock Analysis July 23, 2012
 By Tim - http://stockstobuy.org - Twitter - @stockstobuy -
 Facebook (FB) Stock Chart - The following is technical analysis on Facebook (FB) - July 23, 2012
Facebook (FB) Support & Resistance Levels - 7/23/12
Resistance Levels: $30.70
Support Levels: $27
Chart - http://www.stockcharts.com
Facebook (FB) stock dropped below $28 last week. Facebook (FB) will have support down around $27 ahead of earnings this week. FB will have resistance at $30. Facebook (FB) is a buy below $27 for the long term. I think Facebook has hit a bottom ahead of earnings on July 26, 2012.
Today's Stock Gainers - Today's Stock Losers - 2012 Stock Picks - 2012 Penny Stocks - 2012 Stocks to Buy - Day Trading Tips - Stock Trading Rules
Sunday, July 22, 2012
Facebook (FB) Stock Analysis 7/23/12
By Tim - http://stockstobuy.org - Twitter - @stockstobuy - Facebook (FB) Stock Chart - The following is technical analysis on Facebook (FB) - July 23, 2012
Facebook (FB) Support & Resistance Levels - 7/23/12
Resistance Levels: $30.70
Support Levels: $27
Chart - http://www.stockcharts.com
Facebook (FB) stock dropped below $28 last week. Facebook (FB) will have support down around $27 ahead of earnings this week. FB will have resistance at $30. Facebook (FB) is a buy below $27 for the long term. I think Facebook has hit a bottom ahead of earnings on July 26, 2012.
Today's Stock Gainers - Today's Stock Losers - 2012 Stock Picks - 2012 Penny Stocks - 2012 Stocks to Buy - Day Trading Tips - Stock Trading Rules
Tuesday, July 17, 2012
Facebook (FB) Stock Analysis 7/17/12
 By Tim - http://stockstobuy.org - Twitter - @stockstobuy -
 Facebook (FB) Stock Chart - The following is technical analysis on Facebook (FB) - July 17, 2012
Facebook (FB) Support & Resistance Levels - 7/17/12
Resistance Levels: $32.88
Support Levels: $28.50
Chart - http://www.stockcharts.com
Facebook (FB) stock dropped back below $30 on Monday. Facebook (FB) will have support down around $28.50. FB will have resistance at $29.50. Facebook (FB) is a buy below $27 for the long term. Facebook will report earnings on July 26, 2012.
Today's Stock Gainers - Today's Stock Losers - 2012 Stock Picks - 2012 Penny Stocks - 2012 Stocks to Buy - Day Trading Tips - Stock Trading Rules
Monday, July 16, 2012
Facebook (FB) Stock Analysis 7/16/12
 By Tim - http://stockstobuy.org - Twitter - @stockstobuy -
 Facebook (FB) Stock Chart - The following is technical analysis on Facebook (FB) - July 16, 2012
Facebook (FB) Support & Resistance Levels - 7/16/12
Resistance Levels: $32.88
Support Levels: $28.50
Chart - http://www.stockcharts.com
Facebook (FB) stock is still hanging out below $31. Facebook (FB) will have support down around $30 but then nothing until $28.50. FB will have resistance at $32.88. Facebook (FB) is a buy below $27 for the long term. I think Facebook has hit a bottom ahead of earnings on July 26, 2012.
Today's Stock Gainers - Today's Stock Losers - 2012 Stock Picks - 2012 Penny Stocks - 2012 Stocks to Buy - Day Trading Tips - Stock Trading Rules
Sunday, July 15, 2012
Facebook (FB) Stock Analysis July 16, 2012
By Tim - http://stockstobuy.org - Twitter - @stockstobuy - Facebook (FB) Stock Chart - The following is technical analysis on Facebook (FB) - July 16, 2012
Facebook (FB) Support & Resistance Levels - 7/16/12
Resistance Levels: $32.88
Support Levels: $28.50
Chart - http://www.stockcharts.com
Facebook (FB) stock is still hanging out below $31. Facebook (FB) will have support down around $30 but then nothing until $28.50. FB will have resistance at $32.88. Facebook (FB) is a buy below $27 for the long term. I think Facebook has hit a bottom ahead of earnings on July 26, 2012.
Today's Stock Gainers - Today's Stock Losers - 2012 Stock Picks - 2012 Penny Stocks - 2012 Stocks to Buy - Day Trading Tips - Stock Trading Rules
Monday, July 9, 2012
Facebook (FB) Stock Analysis July 9, 2012
 By Tim - http://stockstobuy.org - Twitter - @stockstobuy -
 Facebook (FB) Stock Chart - The following is technical analysis on Facebook (FB) - July 9, 2012
Facebook (FB) Support & Resistance Levels - 7/9/12
Resistance Levels: $33.45
Support Levels: $30
Chart - http://www.stockcharts.com
Facebook (FB) stock is still hanging out in the $31's. Facebook (FB) will have support down around $30. FB will have resistance at $33.45. Facebook (FB) is a buy below $27 for the long term. I think Facebook has hit a bottom ahead of earnings in July 2012.
Today's Stock Gainers - Today's Stock Losers - 2012 Stock Picks - 2012 Penny Stocks - 2012 Stocks to Buy - Day Trading Tips - Stock Trading Rules
Sunday, July 8, 2012
Facebook (FB) Stock Analysis 7/9/12
By Tim - http://stockstobuy.org - Twitter - @stockstobuy - Facebook (FB) Stock Chart - The following is technical analysis on Facebook (FB) - July 9, 2012
Facebook (FB) Support & Resistance Levels - 7/9/12
Resistance Levels: $33.45
Support Levels: $30
Chart - http://www.stockcharts.com
Facebook (FB) stock is still hanging out in the $31's. Facebook (FB) will have support down around $30. FB will have resistance at $33.45. Facebook (FB) is a buy below $27 for the long term. I think Facebook has hit a bottom ahead of earnings in July 2012.
Today's Stock Gainers - Today's Stock Losers - 2012 Stock Picks - 2012 Penny Stocks - 2012 Stocks to Buy - Day Trading Tips - Stock Trading Rules
Tuesday, July 3, 2012
Facebook (FB) Stock Analysis July 3, 2012
 By Tim - http://stockstobuy.org - Twitter - @stockstobuy -
 Facebook (FB) Stock Chart - The following is technical analysis on Facebook (FB) - July 3, 2012
Facebook (FB) Support & Resistance Levels - 7/3/12
Resistance Levels: $31.73
Support Levels: $30
Chart - http://www.stockcharts.com
Facebook (FB) stock is breaking down after a huge rally in June. Facebook (FB) will have support down around $30. FB will have resistance at $31.73. Facebook (FB) is a buy below $27 for the long term. I think Facebook has hit a bottom ahead of earnings in July 2012.
Today's Stock Gainers - Today's Stock Losers - 2012 Stock Picks - 2012 Penny Stocks - 2012 Stocks to Buy - Day Trading Tips - Stock Trading Rules
Monday, July 2, 2012
Facebook (FB) Technical Analysis July 2012
 By Tim - http://stockstobuy.org - Twitter - @stockstobuy -
 Facebook (FB) Stock Chart - The following is technical analysis on Facebook (FB) - July 2, 2012
Facebook (FB) Support & Resistance Levels - 7/2/12
Resistance Levels: $33.45
Support Levels: $30.70
Chart - http://www.stockcharts.com
Facebook (FB) stock dropped last week after a monster rally in the stock market. Facebook (FB) will have support down around $30.70. FB will have resistance at $33.45. Facebook (FB) is a buy below $27 for the long term. I think Facebook has hit a bottom ahead of earnings in July 2012.
Today's Stock Gainers - Today's Stock Losers - 2012 Stock Picks - 2012 Penny Stocks - 2012 Stocks to Buy - Day Trading Tips - Stock Trading Rules
Saturday, June 30, 2012
Facebook (FB) Stock Analysis July 2, 2012
By Tim - http://stockstobuy.org - Twitter - @stockstobuy - Facebook (FB) Stock Chart - The following is technical analysis on Facebook (FB) - July 2, 2012
Facebook (FB) Support & Resistance Levels - 7/2/12
Resistance Levels: $33.45
Support Levels: $30.70
Chart - http://www.stockcharts.com
Facebook (FB) stock dropped last week after a monster rally in the stock market. Facebook (FB) will have support down around $30.70. FB will have resistance at $33.45. Facebook (FB) is a buy below $27 for the long term. I think Facebook has hit a bottom ahead of earnings in July 2012.
Today's Stock Gainers - Today's Stock Losers - 2012 Stock Picks - 2012 Penny Stocks - 2012 Stocks to Buy - Day Trading Tips - Stock Trading Rules
Thursday, June 28, 2012
Facebook (FB) Stock Analysis June 28, 2012
 By Tim - http://stockstobuy.org - Twitter - @stockstobuy -
 Facebook (FB) Stock Chart - The following is technical analysis on Facebook (FB) - June 28, 2012
Facebook (FB) Support & Resistance Levels - 6/28/12
Resistance Levels: $33.45
Support Levels: $30.70
Chart - http://www.stockcharts.com
Facebook (FB) stock is now retesting the 10 day moving average. Facebook (FB) will have support down around $30.70. FB will have resistance at $33.45. Facebook (FB) is a buy below $27 for the long term. I think Facebook has hit a bottom ahead of earnings in July 2012.
Today's Stock Gainers - Today's Stock Losers - 2012 Stock Picks - 2012 Penny Stocks - 2012 Stocks to Buy - Day Trading Tips - Stock Trading Rules
Wednesday, June 27, 2012
Facebook (FB) Stock Analysis June 27, 2012
 By Tim - http://stockstobuy.org - Twitter - @stockstobuy -
 Facebook (FB) Stock Chart - The following is technical analysis on Facebook (FB) - June 27, 2012
Facebook (FB) Support & Resistance Levels - 6/27/12
Resistance Levels: $33.45
Support Levels: $30.70
Chart - http://www.stockcharts.com
Facebook (FB) stock continues to trade very strong. Facebook (FB) will now have support down around $30.70. FB will have resistance at $33.45. Facebook (FB) is a buy below $27 for the long term. I think Facebook has hit a bottom ahead of earnings in July 2012.
Today's Stock Gainers - Today's Stock Losers - 2012 Stock Picks - 2012 Penny Stocks - 2012 Stocks to Buy - Day Trading Tips - Stock Trading Rules
Tuesday, June 26, 2012
Facebook (FB) Stock Analysis June 26, 2012
 By Tim - http://stockstobuy.org - Twitter - @stockstobuy -
 Facebook (FB) Stock Chart - The following is technical analysis on Facebook (FB) - June 26, 2012
Facebook (FB) Support & Resistance Levels - 6/26/12
Resistance Levels: $33.45
Support Levels: $30.70
Chart - http://www.stockcharts.com
Facebook (FB) stock continues to be very strong. Facebook (FB) will now have support down around $30.70. FB will have resistance at $33.45. Facebook (FB) is a buy below $27 for the long term. I think Facebook has hit a bottom ahead of earnings in July 2012.
Today's Stock Gainers - Today's Stock Losers - 2012 Stock Picks - 2012 Penny Stocks - 2012 Stocks to Buy - Day Trading Tips - Stock Trading Rules
Subscribe to:
Posts (Atom)