 By Tim - http://stockstobuy.org
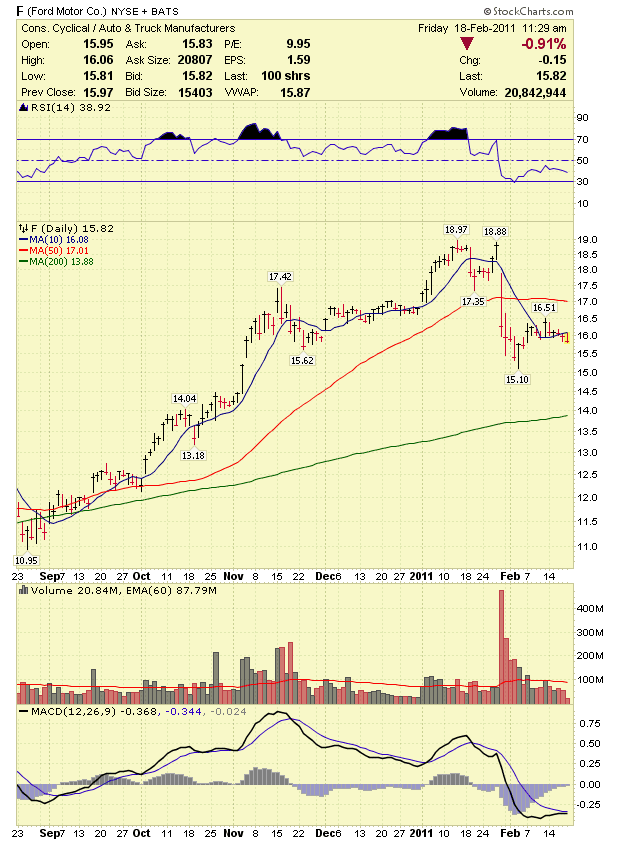
Ford Stock Chart - The following is technical analysis for Ford Motor Company ( F ) - February 18, 2011
Ford Motor Co. (NYSE: F ) Support & Resistance Levels - 2/18/11
Resistance Levels: $16.08, $16.51, $17
Support Levels: $15.60, $15.10
Chart - http://www.stockcharts.com
Ford (NYSE:F) dropped below the 10 day moving average over the past two days. Ford (F) could not hold this level which is bearish for the short term. Ford will now have resistance on the upside located at $16.51. I continue to like Ford below $16 for the long term but won't get involved until the lower $15's and a break below $15. F stock most likely put in a bottom at $15.10 and remains a strong buy near or below this level for the rest of 2011. Ford should run back up to $17 when the stock breaks above $16.51.
Today's Biggest Stock Gainers - Top 2011 Stock Gainers - Top 2011 Penny Stock Gainers - Top 2010 Stock Gainers - Top 2010 Penny Stocks - Stocks for 2011
For the latest updates on the stock market, visit, http://daytradingstockblog.blogspot.com/