 By Tim - http://stockstobuy.org
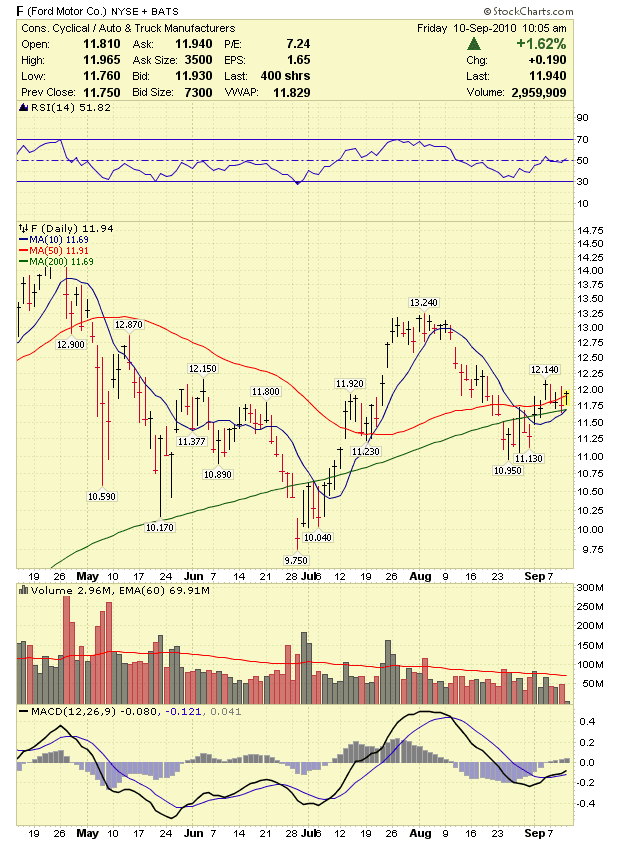
Ford Stock Chart - The following is technical analysis for Ford Motor Company ( F ) - September 10, 2010
Ford Motor Co. ( F ) Support & Resistance Levels - 9/10/10
Resistance Levels: $12.14, $12.45
Support Levels: $11.69, $11
Chart - http://www.stockcharts.com
Ford (NYSE:F) is trading at $11.94 this morning as the stock market is slightly higher. Ford is back above all three major moving averages and doesn't have resistance until $12.14. Ford is a strong buy below $11 for the long term and should benefit from the GM IPO this fall.
Ford (NYSE:F) is trading at $11.94 this morning as the stock market is slightly higher. Ford is back above all three major moving averages and doesn't have resistance until $12.14. Ford is a strong buy below $11 for the long term and should benefit from the GM IPO this fall.
For More Technical Analysis - Go Here
Today's Biggest Stock Market Gainers - Top 2010 Stock Gainers - Top 2010 Penny Stocks - Top 2009 Stock Gainers - Top 2009 Penny Stocks - Stocks for 2010
For the latest updates on the stock market, visit, http://daytradingstockblog.blogspot.com/