 By Tim - http://stockstobuy.org
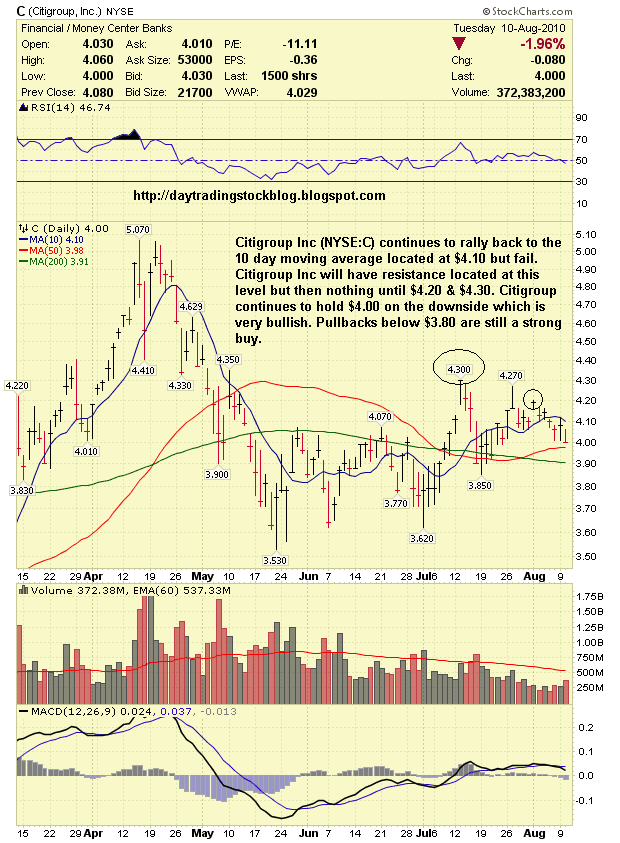
The following is Citigroup Inc. ( C ) stock technical analysis for August 11, 2010
Citigroup Inc (C:NYSE) Support & Resistance Levels - 8/11/10
Resistance Levels: $4.20, $4.27, $4.30, $4.35
Support Levels: $4.00, $3.91, $3.62
Support Levels: $4.00, $3.91, $3.62
Chart - http://www.stockcharts.com/
Citigroup Inc (NYSE:C) continues to rally back to the 10 day moving average located at $4.10 but fail. Citigroup Inc will have resistance located at this level but then nothing until $4.20 & $4.30. Citigroup continues to hold $4.00 on the downside which is very bullish. Pullbacks below $3.80 are still a strong buy.
For more Technical Analysis - Go Here
Today's Biggest Stock Market Gainers - Top 2010 Stock Gainers - Top 2010 Penny Stocks - Top 2009 Stock Gainers - Top 2009 Penny Stocks - Stocks for 2010
For the latest updates on the stock market, visit, http://daytradingstockblog.blogspot.com/
Citigroup Inc (C) - Latest News - Citigroup debt sales could reach $21B in 2010
Citigroup Inc Holdouts on Preferred Swap May Gain 25% When Dividend Resumes