 By Tim - http://stockstobuy.org
The following is Citigroup Inc. ( C ) stock technical analysis for July 8, 2010
Citigroup Inc (C:NYSE) Support & Resistance Levels - 7/8/10
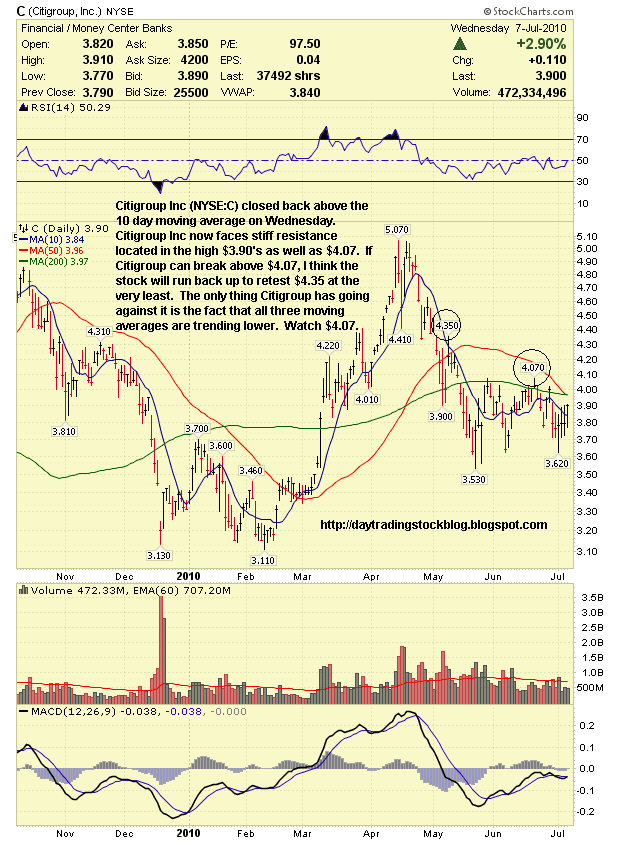
Resistance Levels: $4.07, $4.35
Support Levels: $3.62, $3.53
Support Levels: $3.62, $3.53
Chart - http://www.stockcharts.com/
Citigroup Inc (NYSE:C) closed back above the 10 day moving average on Wednesday. Citigroup Inc now faces stiff resistance located in the high $3.90's as well as $4.07. If Citigroup can break above $4.07, I think the stock will run back up to retest $4.35 at the very least. The only thing Citigroup has going against it is the fact that all three moving averages are trending lower. Watch $4.07.
For more Technical Analysis - Go Here
Today's Biggest Stock Market Gainers - Top 2010 Stock Gainers - Top 2010 Penny Stocks - Top 2009 Stock Gainers - Top 2009 Penny Stocks - Stocks for 2010
For the latest updates on the stock market, visit, http://daytradingstockblog.blogspot.com/
Citigroup Inc (C) - Latest News - Citigroup Said to Sell $900 Million Buyout Stakes to Lexington
Citigroup Inc. Hires Four for European Equity-Derivatives Trading, Memo Says