 By Tim - http://stockstobuy.org
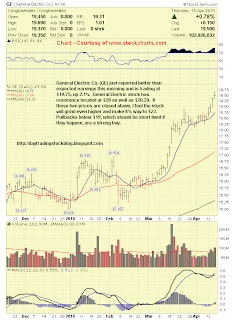
GE Stock Chart - The following is technical analysis of General Electric ( GE ) stock for April 16, 2010
General Electric Co. Support & Resistance Levels - 4/16/10
Resistance Levels: $20, $20.29, $22
Support Levels: $18.76, $18
http://stockcharts.com - Chart
General Electric Co. (GE) just reported better then expected earnings this morning and is trading at $19.75, up 2.1%. General Electric stock has resistance located at $20 as well as $20.29. If these two prices are closed above, I feel the stock will grind even higher and make It's way to $22. Pullbacks below $19, which should be short lived if they happen, are a strong buy.
For More Technical Analysis - Go Here
Today's Biggest Stock Gainers - Top 2010 Stock Gainers - Top 2010 Penny Stocks - Top 2009 Stock Gainers - Top 2009 Penny Stocks - Stocks for 2010
For the latest updates on the stock market, visit, http://daytradingstockblog.blogspot.com/ or Subscribe for Free