 By Tim - http://stockstobuy.org - Twitter - @stockstobuy -
 Facebook (FB) Stock Chart - The following is technical analysis on Facebook (FB) - September 17, 2012
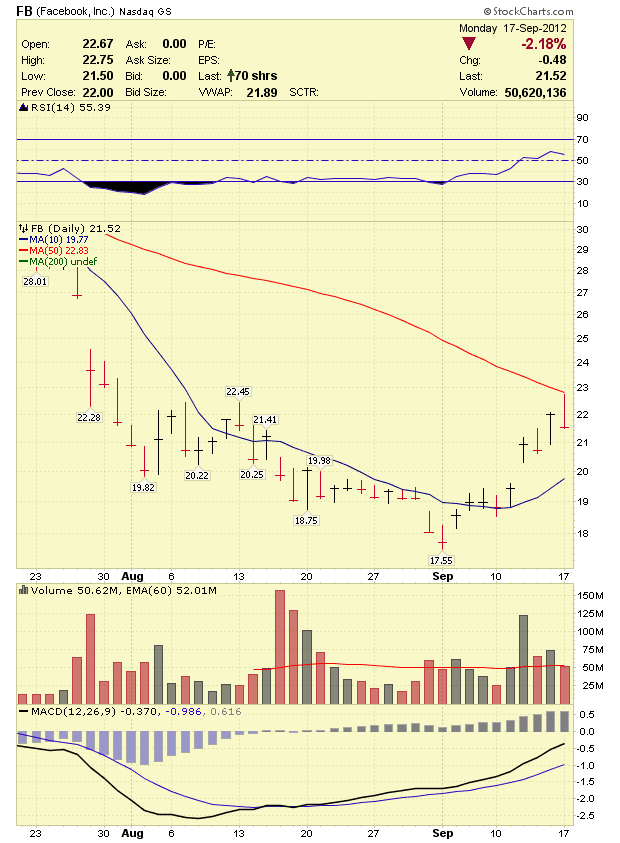
Facebook (FB) Support & Resistance Levels - 9/17/12
Resistance Levels: $22.75
Support Levels: $20
Chart - http://www.stockcharts.com
Facebook (FB) stock failed at the 50 day moving average on Monday and closed down for the day. Facebook (FB) will have support down around $21 as we go forward. FB will have resistance at $22.75. Facebook (FB) is a buy below $20 for a bounce trade. Facebook (FB) should break out again when the stock breaks above $22.75.
Today's Stock Gainers - Today's Stock Losers - 2012 Stock Picks - 2012 Penny Stocks - 2012 Stocks to Buy - Day Trading Tips - Stock Trading Rules
