Hot Stock Alerts

Potential Breakout Stocks of the Day:
Top Stocks 2021 - TSLA BYND GBTC
Top Penny Stocks 2021 - GBTC

Stock Market Closing Report - 12/8/20 December 8, 2020
Showing posts with label predictions. Show all posts

Tuesday, September 18, 2012

Facebook (FB) Stock Analysis September 18, 2012

By Tim - http://stockstobuy.org - Twitter - @stockstobuy -

Facebook (FB) Stock Chart - The following is technical analysis on Facebook (FB) - September 18, 2012

Facebook (FB) Support & Resistance Levels - 9/18/12

Resistance Levels: $22.75

Support Levels: $20

Chart - http://www.stockcharts.com

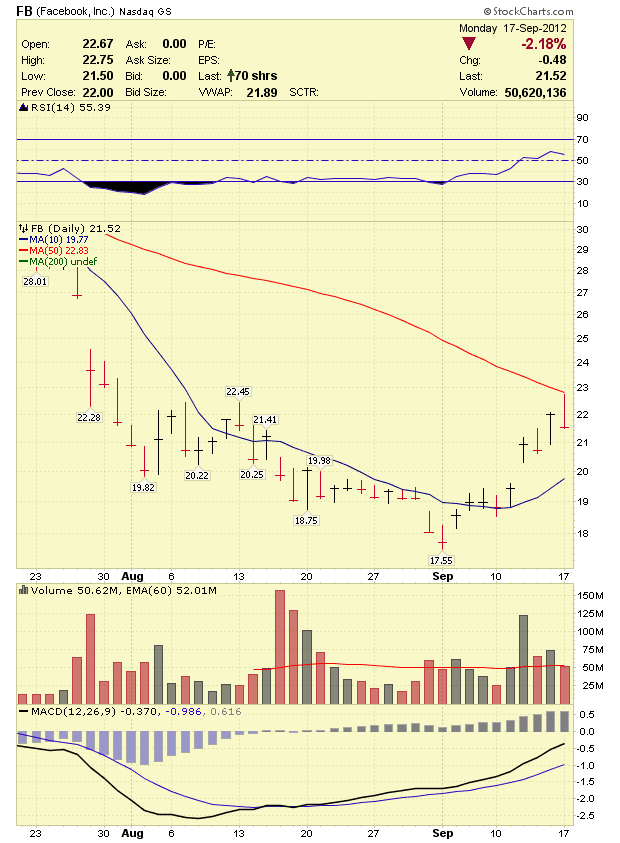
Facebook (FB) stock failed at the 50 day moving average on Monday and closed down for the day. Facebook (FB) will have support down around $21 as we go forward. FB will have resistance at $22.75. Facebook (FB) is a buy below $20 for a bounce trade. Facebook (FB) should break out again when the stock breaks above $22.75.


For the latest updates on the stock market, visit, http://daytradingstockblog.blogspot.com/


Monday, September 17, 2012

Facebook (FB) Stock Analysis September 17, 2012

By Tim - http://stockstobuy.org - Twitter - @stockstobuy -

Facebook (FB) Stock Chart - The following is technical analysis on Facebook (FB) - September 17, 2012

Facebook (FB) Support & Resistance Levels - 9/17/12

Resistance Levels: $22.75

Support Levels: $20

Chart - http://www.stockcharts.com

Facebook (FB) stock failed at the 50 day moving average on Monday and closed down for the day. Facebook (FB) will have support down around $21 as we go forward. FB will have resistance at $22.75. Facebook (FB) is a buy below $20 for a bounce trade. Facebook (FB) should break out again when the stock breaks above $22.75.


For the latest updates on the stock market, visit, http://daytradingstockblog.blogspot.com/


Wednesday, August 29, 2012

Bank of America (BAC) Stock Analysis August 29, 2012

By Tim - http://stockstobuy.org - Twitter - @stockstobuy -

Bank of America (BAC) Stock Chart - The following is technical analysis on Bank of America ( BAC ) - August 29, 2012

Bank of America (BAC) Support & Resistance Levels - 8/29/12

Resistance Levels: $8.40

Support Levels: $7.50

Chart - http://www.stockcharts.com

Bank of America (BAC) is back testing the 10 day moving average on Wednesday. Bank of America (BAC) will have support down at $7.95 and $7.50. If Bank of America (BAC) drops back below $7.50, the next major level to watch is $6.90. BAC stock is a strong buy below $7.25. I currently have an $8.50 price target on Bank or America (BAC) for the rest of 2012.


For the latest updates on the stock market, visit, http://daytradingstockblog.blogspot.com/


Wednesday, August 1, 2012

Bank of America (BAC) Stock Analysis August 2012

By Tim - http://stockstobuy.org - Twitter - @stockstobuy -

Bank of America (BAC) Stock Chart - The following is technical analysis on Bank of America ( BAC ) - August 1, 2012

Bank of America (BAC) Support & Resistance Levels - 8/1/12

Resistance Levels: $7.96

Support Levels: $6.90, $6.85, $6.71

Chart - http://www.stockcharts.com

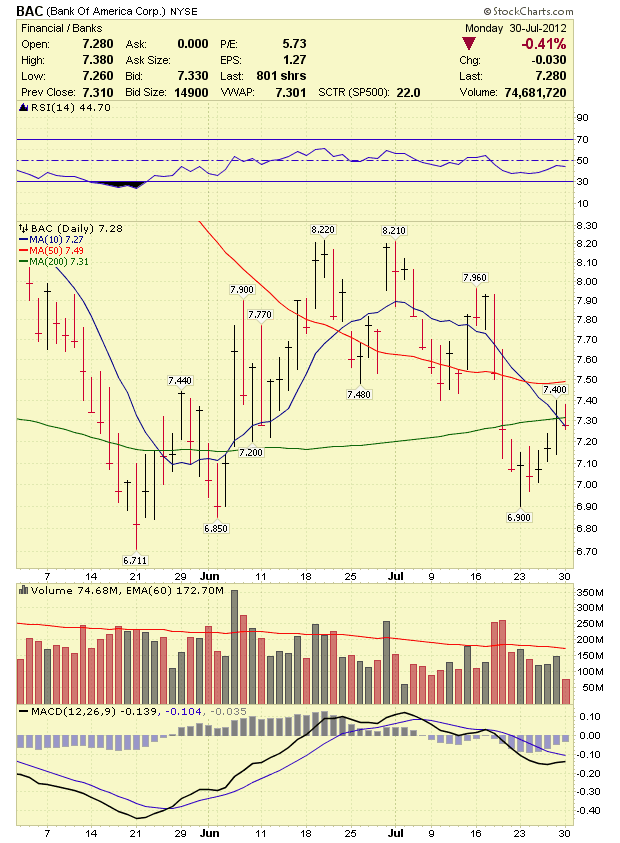
Bank of America (BAC) stock continues to trade in the low $7's. Bank of America (BAC) will have support down at $6.90, $6.85, and $6.71. If Bank of America (BAC) drops back below $6.71, the next major level to watch is $6.00. BAC stock is a strong buy below $7. I currently have an $8.50 price target on Bank or America (BAC) for the rest of 2012.


For the latest updates on the stock market, visit, http://daytradingstockblog.blogspot.com/


Tuesday, July 31, 2012

Facebook (FB) Stock Analysis July 31, 2012

By Tim - http://stockstobuy.org - Twitter - @stockstobuy -

Facebook (FB) Stock Chart - The following is technical analysis on Facebook (FB) - July 31, 2012

Facebook (FB) Support & Resistance Levels - 7/31/12

Resistance Levels: $24.54

Support Levels: $23

Chart - http://www.stockcharts.com

Facebook (FB) stock dropped again on Monday. Facebook (FB) will have support down around $23 as we go forward. FB will have resistance at $25. Facebook (FB) is a buy below $21 for a bounce trade. Facebook (FB) should break out again when the stock breaks above $24.54


For the latest updates on the stock market, visit, http://daytradingstockblog.blogspot.com/


Bank of America (BAC) Stock Analysis July 31, 2012

By Tim - http://stockstobuy.org - Twitter - @stockstobuy -

Bank of America (BAC) Stock Chart - The following is technical analysis on Bank of America ( BAC ) - July 31, 2012

Bank of America (BAC) Support & Resistance Levels - 7/31/12

Resistance Levels: $7.96

Support Levels: $6.90, $6.85, $6.71

Chart - http://www.stockcharts.com

Bank of America (BAC) stock failed to break Friday's high of $7.40 but is still looking good. Bank of America (BAC) will have support down at $6.90, $6.85, and $6.71. If Bank of America (BAC) drops back below $6.71, the next major level to watch is $6.00. BAC stock is a strong buy below $7. I currently have an $8.50 price target on Bank or America (BAC) for the rest of 2012.


For the latest updates on the stock market, visit, http://daytradingstockblog.blogspot.com/


Monday, July 30, 2012

Facebook (FB) Stock Analysis July 30, 2012

By Tim - http://stockstobuy.org - Twitter - @stockstobuy -

Facebook (FB) Stock Chart - The following is technical analysis on Facebook (FB) - July 30, 2012

Facebook (FB) Support & Resistance Levels - 7/30/12

Resistance Levels: $24.54

Support Levels: $23

Chart - http://www.stockcharts.com

Facebook (FB) stock crashed after the company reported inline earnings. Facebook (FB) will have support down around $23 as we go forward. FB will have resistance at $25. Facebook (FB) is a buy below $21 for a bounce trade. Facebook (FB) should break out again when the stock breaks above $24.54


For the latest updates on the stock market, visit, http://daytradingstockblog.blogspot.com/


Bank of America (BAC) Stock Analysis July 30, 2012

By Tim - http://stockstobuy.org - Twitter - @stockstobuy -

Bank of America (BAC) Stock Chart - The following is technical analysis on Bank of America ( BAC ) - July 30, 2012

Bank of America (BAC) Support & Resistance Levels - 7/30/12

Resistance Levels: $7.96

Support Levels: $6.90, $6.85, $6.71

Chart - http://www.stockcharts.com

Bank of America (BAC) stock closed at the 200 day moving average on Friday. Bank of America (BAC) will have support down at $6.90, $6.85, and $6.71. If Bank of America (BAC) drops back below $6.71, the next major level to watch is $6.00. BAC stock is a strong buy below $7. I currently have an $8.50 price target on Bank or America (BAC) for the rest of 2012.


For the latest updates on the stock market, visit, http://daytradingstockblog.blogspot.com/


Sunday, July 29, 2012

Facebook (FB) Stock Analysis 7/30/12

By Tim - http://stockstobuy.org - Twitter - @stockstobuy -

Facebook (FB) Stock Chart - The following is technical analysis on Facebook (FB) - July 30, 2012

Facebook (FB) Support & Resistance Levels - 7/30/12

Resistance Levels: $24.54

Support Levels: $23

Chart - http://www.stockcharts.com

Facebook (FB) stock crashed after the company reported inline earnings. Facebook (FB) will have support down around $23 as we go forward. FB will have resistance at $25. Facebook (FB) is a buy below $21 for a bounce trade. Facebook (FB) should break out again when the stock breaks above $24.54


For the latest updates on the stock market, visit, http://daytradingstockblog.blogspot.com/


Bank of America (BAC) Stock Analysis 7/30/12

By Tim - http://stockstobuy.org - Twitter - @stockstobuy -

Bank of America (BAC) Stock Chart - The following is technical analysis on Bank of America ( BAC ) - July 30, 2012

Bank of America (BAC) Support & Resistance Levels - 7/30/12

Resistance Levels: $7.96

Support Levels: $6.90, $6.85, $6.71

Chart - http://www.stockcharts.com

Bank of America (BAC) stock closed at the 200 day moving average on Friday. Bank of America (BAC) will have support down at $6.90, $6.85, and $6.71. If Bank of America (BAC) drops back below $6.71, the next major level to watch is $6.00. BAC stock is a strong buy below $7. I currently have an $8.50 price target on Bank or America (BAC) for the rest of 2012.


For the latest updates on the stock market, visit, http://daytradingstockblog.blogspot.com/


Thursday, July 26, 2012

Facebook (FB) Stock Analysis July 26, 2012

By Tim - http://stockstobuy.org - Twitter - @stockstobuy -

Facebook (FB) Stock Chart - The following is technical analysis on Facebook (FB) - July 26, 2012

Facebook (FB) Support & Resistance Levels - 7/26/12

Resistance Levels: $29.25

Support Levels: $27

Chart - http://www.stockcharts.com

Facebook (FB) stock dropped back below $28 today ahead of earnings. Facebook (FB) is expected to report earnings of $0.12 on $1.15 billion in revenue (more...). FB will have resistance at $30. Facebook (FB) is a buy below $27 for the long term. I think Facebook will rally back into the $30's at some point soon.


For the latest updates on the stock market, visit, http://daytradingstockblog.blogspot.com/

Monday, July 23, 2012

Facebook (FB) Stock Analysis July 23, 2012

By Tim - http://stockstobuy.org - Twitter - @stockstobuy -

Facebook (FB) Stock Chart - The following is technical analysis on Facebook (FB) - July 23, 2012

Facebook (FB) Support & Resistance Levels - 7/23/12

Resistance Levels: $30.70

Support Levels: $27

Chart - http://www.stockcharts.com

Facebook (FB) stock dropped below $28 last week. Facebook (FB) will have support down around $27 ahead of earnings this week. FB will have resistance at $30. Facebook (FB) is a buy below $27 for the long term. I think Facebook has hit a bottom ahead of earnings on July 26, 2012.


For the latest updates on the stock market, visit, http://daytradingstockblog.blogspot.com/


Bank of America (BAC) Stock Analysis 7/23/12

By Tim - http://stockstobuy.org - Twitter - @stockstobuy -

Bank of America (BAC) Stock Chart - The following is technical analysis on Bank of America ( BAC ) - July 23, 2012

Bank of America (BAC) Support & Resistance Levels - 7/23/12

Resistance Levels: $7.96

Support Levels: $6.85, $6.71

Chart - http://www.stockcharts.com

Bank of America (BAC) stock is back trading near $7 again. Bank of America (BAC) will have support down at $6.85 as well as $6.71. If Bank of America (BAC) drops back below $6.71, the next major level to watch is $6.00. BAC stock is a strong buy below $7. I currently have an $8.50 price target on Bank or America (BAC) for the rest of 2012.


For the latest updates on the stock market, visit, http://daytradingstockblog.blogspot.com/


Sunday, July 22, 2012

Facebook (FB) Stock Analysis 7/23/12

By Tim - http://stockstobuy.org - Twitter - @stockstobuy -

Facebook (FB) Stock Chart - The following is technical analysis on Facebook (FB) - July 23, 2012

Facebook (FB) Support & Resistance Levels - 7/23/12

Resistance Levels: $30.70

Support Levels: $27

Chart - http://www.stockcharts.com

Facebook (FB) stock dropped below $28 last week. Facebook (FB) will have support down around $27 ahead of earnings this week. FB will have resistance at $30. Facebook (FB) is a buy below $27 for the long term. I think Facebook has hit a bottom ahead of earnings on July 26, 2012.


For the latest updates on the stock market, visit, http://daytradingstockblog.blogspot.com/


Bank of America (BAC) Stock Analysis July 23. 2012

By Tim - http://stockstobuy.org - Twitter - @stockstobuy -

Bank of America (BAC) Stock Chart - The following is technical analysis on Bank of America ( BAC ) - July 23, 2012

Bank of America (BAC) Support & Resistance Levels - 7/23/12

Resistance Levels: $7.96

Support Levels: $6.85, $6.71

Chart - http://www.stockcharts.com

Bank of America (BAC) stock is back trading near $7 again. Bank of America (BAC) will have support down at $6.85 as well as $6.71. If Bank of America (BAC) drops back below $6.71, the next major level to watch is $6.00. BAC stock is a strong buy below $7. I currently have an $8.50 price target on Bank or America (BAC) for the rest of 2012.


For the latest updates on the stock market, visit, http://daytradingstockblog.blogspot.com/


Tuesday, July 17, 2012

Facebook (FB) Stock Analysis 7/17/12

By Tim - http://stockstobuy.org - Twitter - @stockstobuy -

Facebook (FB) Stock Chart - The following is technical analysis on Facebook (FB) - July 17, 2012

Facebook (FB) Support & Resistance Levels - 7/17/12

Resistance Levels: $32.88

Support Levels: $28.50

Chart - http://www.stockcharts.com

Facebook (FB) stock dropped back below $30 on Monday. Facebook (FB) will have support down around $28.50. FB will have resistance at $29.50. Facebook (FB) is a buy below $27 for the long term. Facebook will report earnings on July 26, 2012.


For the latest updates on the stock market, visit, http://daytradingstockblog.blogspot.com/


Bank of America (BAC) Stock Analysis July 17, 2012

By Tim - http://stockstobuy.org - Twitter - @stockstobuy -

Bank of America (BAC) Stock Chart - The following is technical analysis on Bank of America ( BAC ) - July 17, 2012

Bank of America (BAC) Support & Resistance Levels - 7/17/12

Resistance Levels: $8.22, $8.39

Support Levels: $7.55

Chart - http://www.stockcharts.com

Bank of America (BAC) stock is back trading above all three major moving averages. Bank of America (BAC) will have support down at $7.50. If Bank of America (BAC) drops back below $7.48, the next major level to watch is $7.20. BAC stock is a strong buy below $7. I currently have an $8.50 price target on Bank or America (BAC) for the rest of 2012.


For the latest updates on the stock market, visit, http://daytradingstockblog.blogspot.com/


Monday, July 16, 2012

Facebook (FB) Stock Analysis 7/16/12

By Tim - http://stockstobuy.org - Twitter - @stockstobuy -

Facebook (FB) Stock Chart - The following is technical analysis on Facebook (FB) - July 16, 2012

Facebook (FB) Support & Resistance Levels - 7/16/12

Resistance Levels: $32.88

Support Levels: $28.50

Chart - http://www.stockcharts.com

Facebook (FB) stock is still hanging out below $31. Facebook (FB) will have support down around $30 but then nothing until $28.50. FB will have resistance at $32.88. Facebook (FB) is a buy below $27 for the long term. I think Facebook has hit a bottom ahead of earnings on July 26, 2012.


For the latest updates on the stock market, visit, http://daytradingstockblog.blogspot.com/


Buy Bank of America (BAC) Stock?

By Tim - http://stockstobuy.org - Twitter - @stockstobuy -

Bank of America (BAC) Stock Chart - The following is technical analysis on Bank of America ( BAC ) - July 16, 2012

Bank of America (BAC) Support & Resistance Levels - 7/16/12

Resistance Levels: $8.22, $8.39

Support Levels: $7.55

Chart - http://www.stockcharts.com

Bank of America (BAC) stock is back above $7.50. Bank of America (BAC) will have support down at $7.50. If Bank of America (BAC) drops back below $7.48, the next major level to watch is $7.20. BAC stock is a strong buy below $7. I currently have an $8.50 price target on Bank or America (BAC) for the rest of 2012.


For the latest updates on the stock market, visit, http://daytradingstockblog.blogspot.com/


Sunday, July 15, 2012

Bank of America (BAC) Stock Analysis July 16, 2012

By Tim - http://stockstobuy.org - Twitter - @stockstobuy -

Bank of America (BAC) Stock Chart - The following is technical analysis on Bank of America ( BAC ) - July 16, 2012

Bank of America (BAC) Support & Resistance Levels - 7/16/12

Resistance Levels: $8.22, $8.39

Support Levels: $7.55

Chart - http://www.stockcharts.com

Bank of America (BAC) stock is back above $7.50. Bank of America (BAC) will have support down at $7.50. If Bank of America (BAC) drops back below $7.48, the next major level to watch is $7.20. BAC stock is a strong buy below $7. I currently have an $8.50 price target on Bank or America (BAC) for the rest of 2012.


For the latest updates on the stock market, visit, http://daytradingstockblog.blogspot.com/


Copyright © 2008-2020 - daytradingstockblog.blogspot.com

Stocks to Buy 2020 - Click Here